v1.2.0
Axes location & Scale types
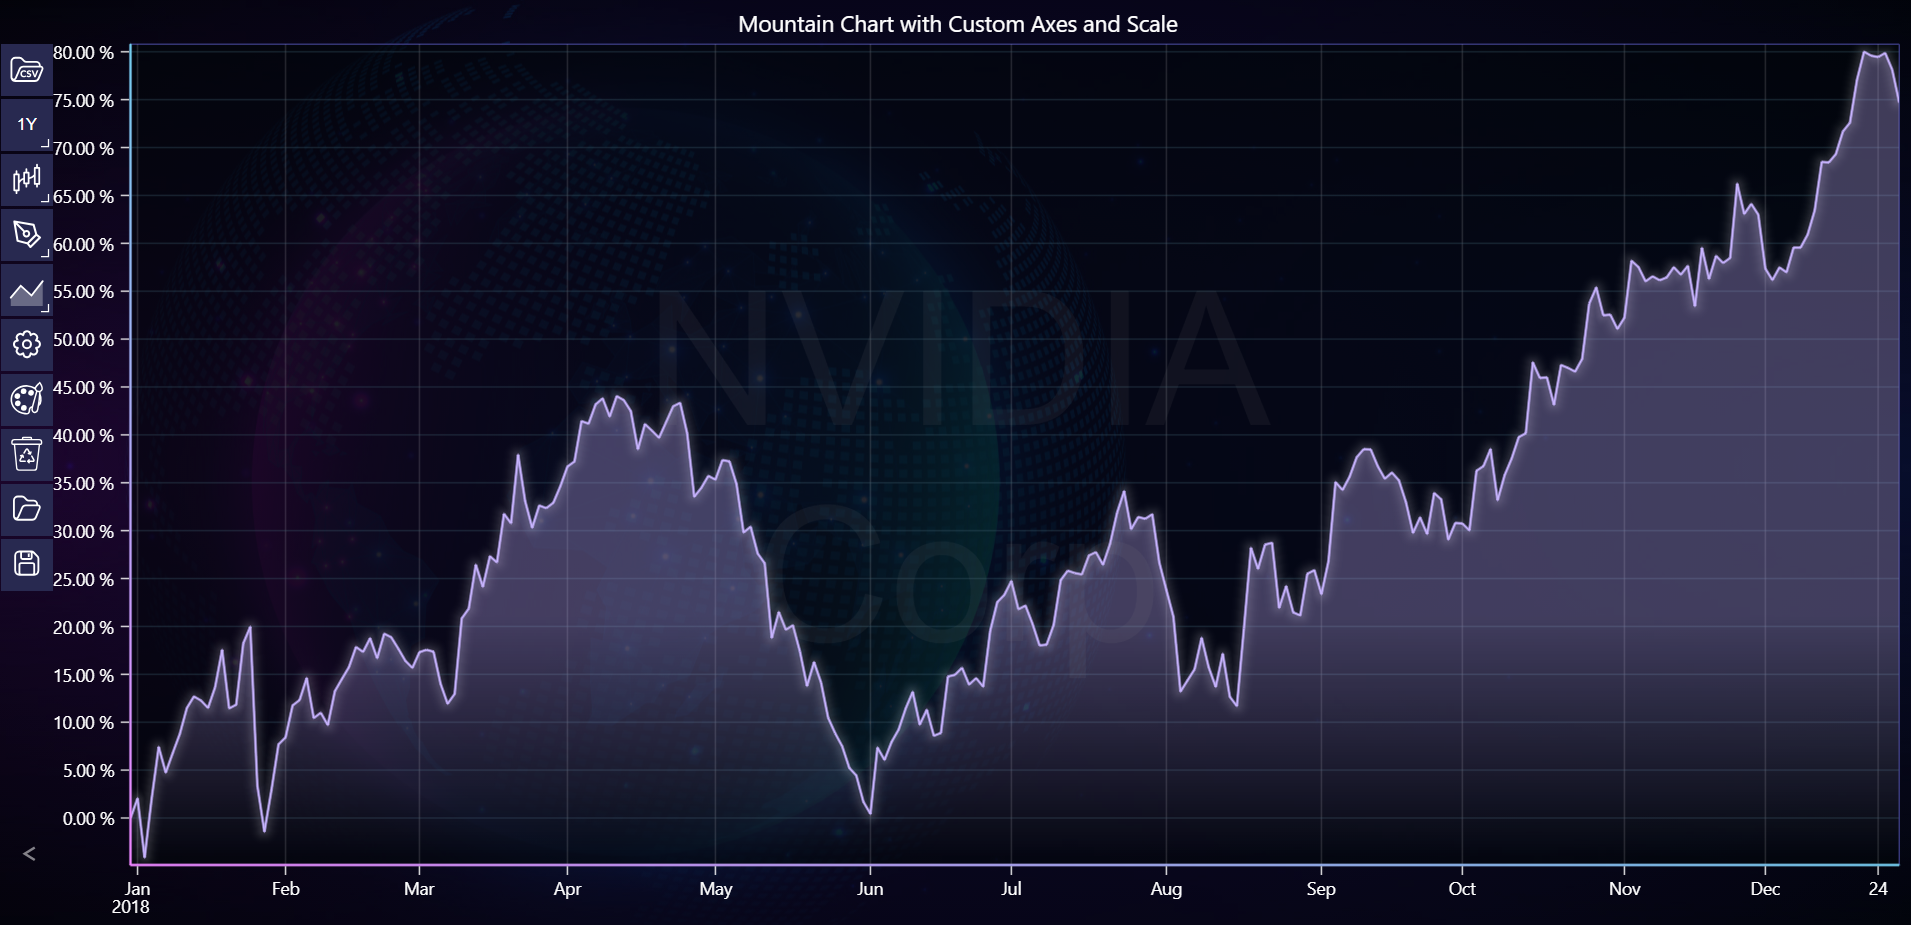
In the example below, you can explore how to change axes location and apply percent scale to the chart using the LightningChart Python Trader. Full code and dataset are provided at the bottom of the page.
Download 'NVIDIA Corp (NVDA) - 10y.csv'
from lightningchart_trader import TAChart
from datetime import datetime

LICENSE_KEY_PATH = "license_key.txt"
DATA_PATH = "NVIDIA Corp (NVDA) - 10y.csv"

# Load the license key
license_key = open(LICENSE_KEY_PATH).read()

chart = TAChart(license_key=license_key)

# Set chart title and theme
chart.set_chart_title('Mountain Chart with Custom Axes and Scale')
chart.set_color_theme('cyberSpace')

# Load CSV data
chart.load_csv(DATA_PATH)

# Set time range
start_time = datetime(2018, 12, 31)
end_time = datetime(2019, 12, 31)
chart.set_time_range(start_time, end_time)

# Set chart type to Mountain
chart.set_price_chart_type('Mountain')

# Set axes location and scale types
chart.set_axis_alignment(False)
chart.set_percent_scale(True)

chart.show_symbol_watermark(True)
chart.set_watermark_text('NVIDIA Corp')


# Open the chart
chart.open()