v1.2.0
Line Drawing Tools
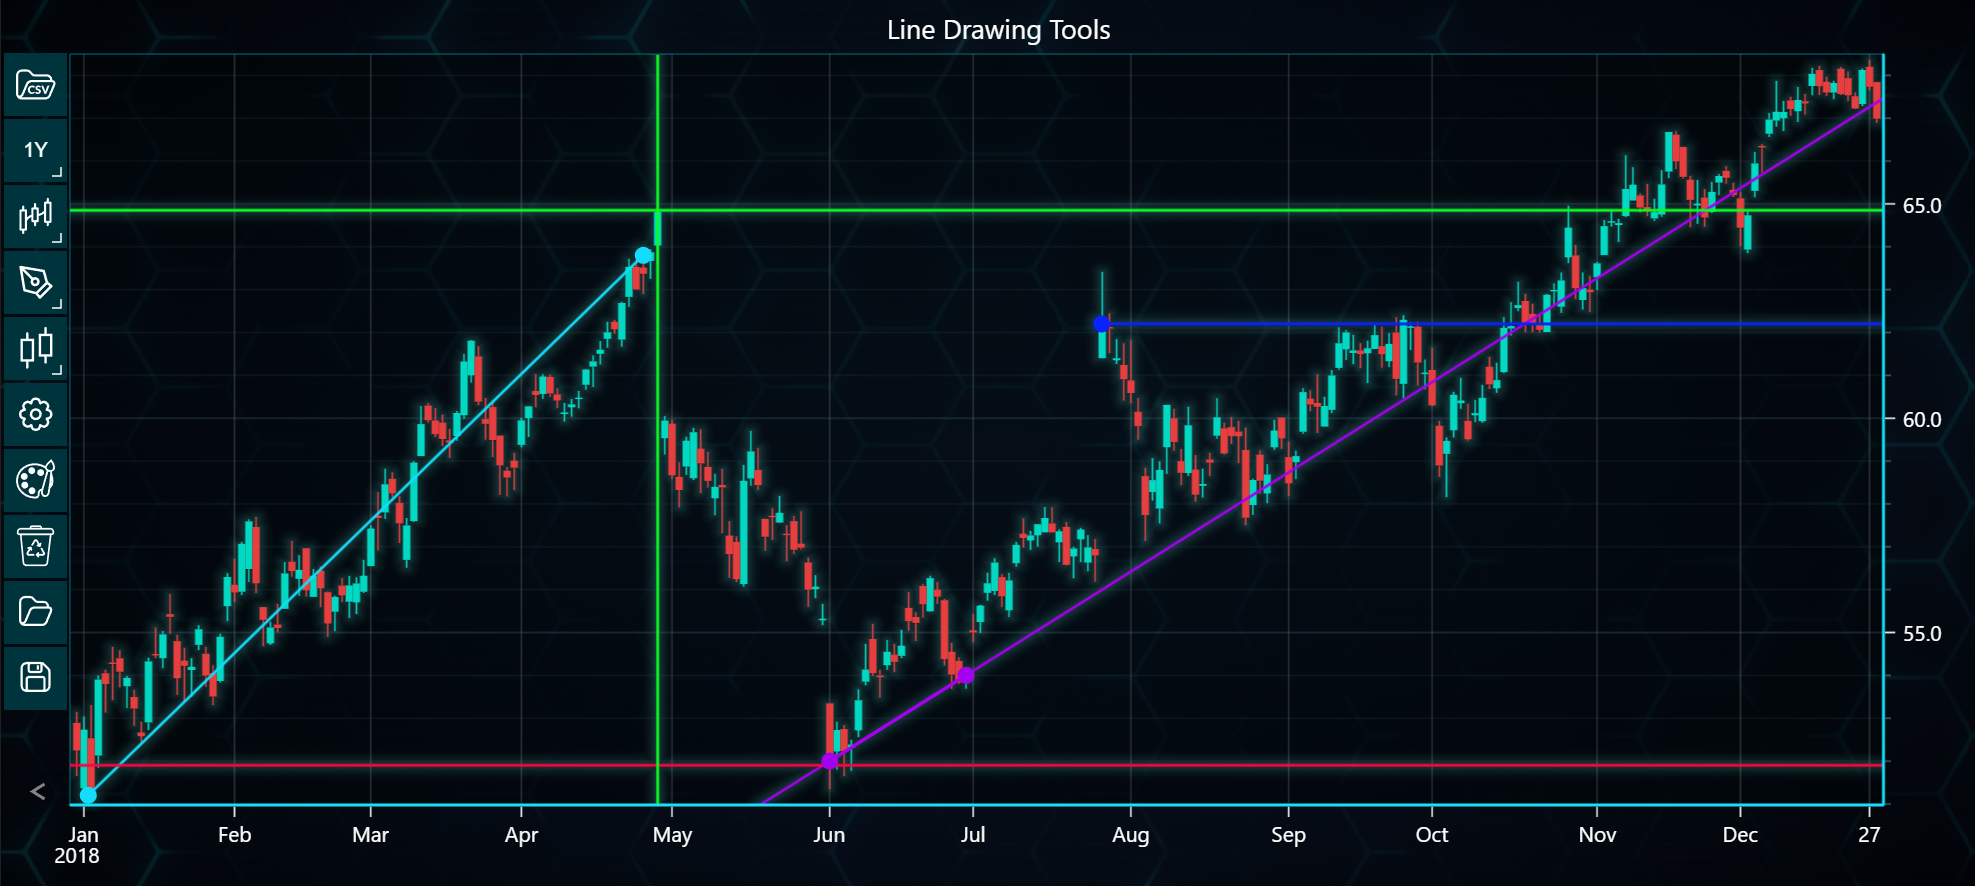
In the example below, you can explore line drawing tools and how to use them with LightningChart Python Trader. Full code and dataset are provided at the bottom of the page.
from lightningchart_trader import TAChart

LICENSE_KEY_PATH = "license_key.txt"
DATA_PATH = "Alphabet Inc - Class A (GOOGL) - 10y.csv"

# Load the license key
license_key = open(LICENSE_KEY_PATH).read()

chart = TAChart(license_key)

# Read data from CSV file
chart.load_csv(DATA_PATH)
chart.change_time_range(4)

chart.set_chart_title('Line Drawing Tools')

# Adding Extended Line
extended_line = chart.add_extended_line(124, 54, 105, 52)
extended_line.set_extend_lines(True, True)
extended_line.set_line_color('#a302ed')
extended_line.set_line_width(2)

# Adding another Horizontal Line
horizontal_line_2 = chart.add_horizontal_line(64.85)
horizontal_line_2.set_line_color('#0AFC22')
horizontal_line_2.set_line_width(2)

# Adding Horizontal Line
horizontal_ray = chart.add_horizontal_line(51.9)
horizontal_ray.set_line_color('#f70844')
horizontal_ray.set_line_width(2)

# Adding Trend Line
trend_line = chart.add_trend_line(79, 63.8, 1.6, 51.2)
trend_line.set_line_width(2)

# Adding Vertical Line
vertical_line = chart.add_vertical_line(81)
vertical_line.set_line_color('#0AFC22')
vertical_line.set_line_width(2)

# Adding Horizontal Ray
horizontal_ray_line = chart.add_horizontal_ray(142.9, 62.2)
horizontal_ray_line.set_line_color('#0A22FC')
horizontal_ray_line.set_line_width(2)

# Open the chart
chart.open()