v1.2.0
Symbols & Objects
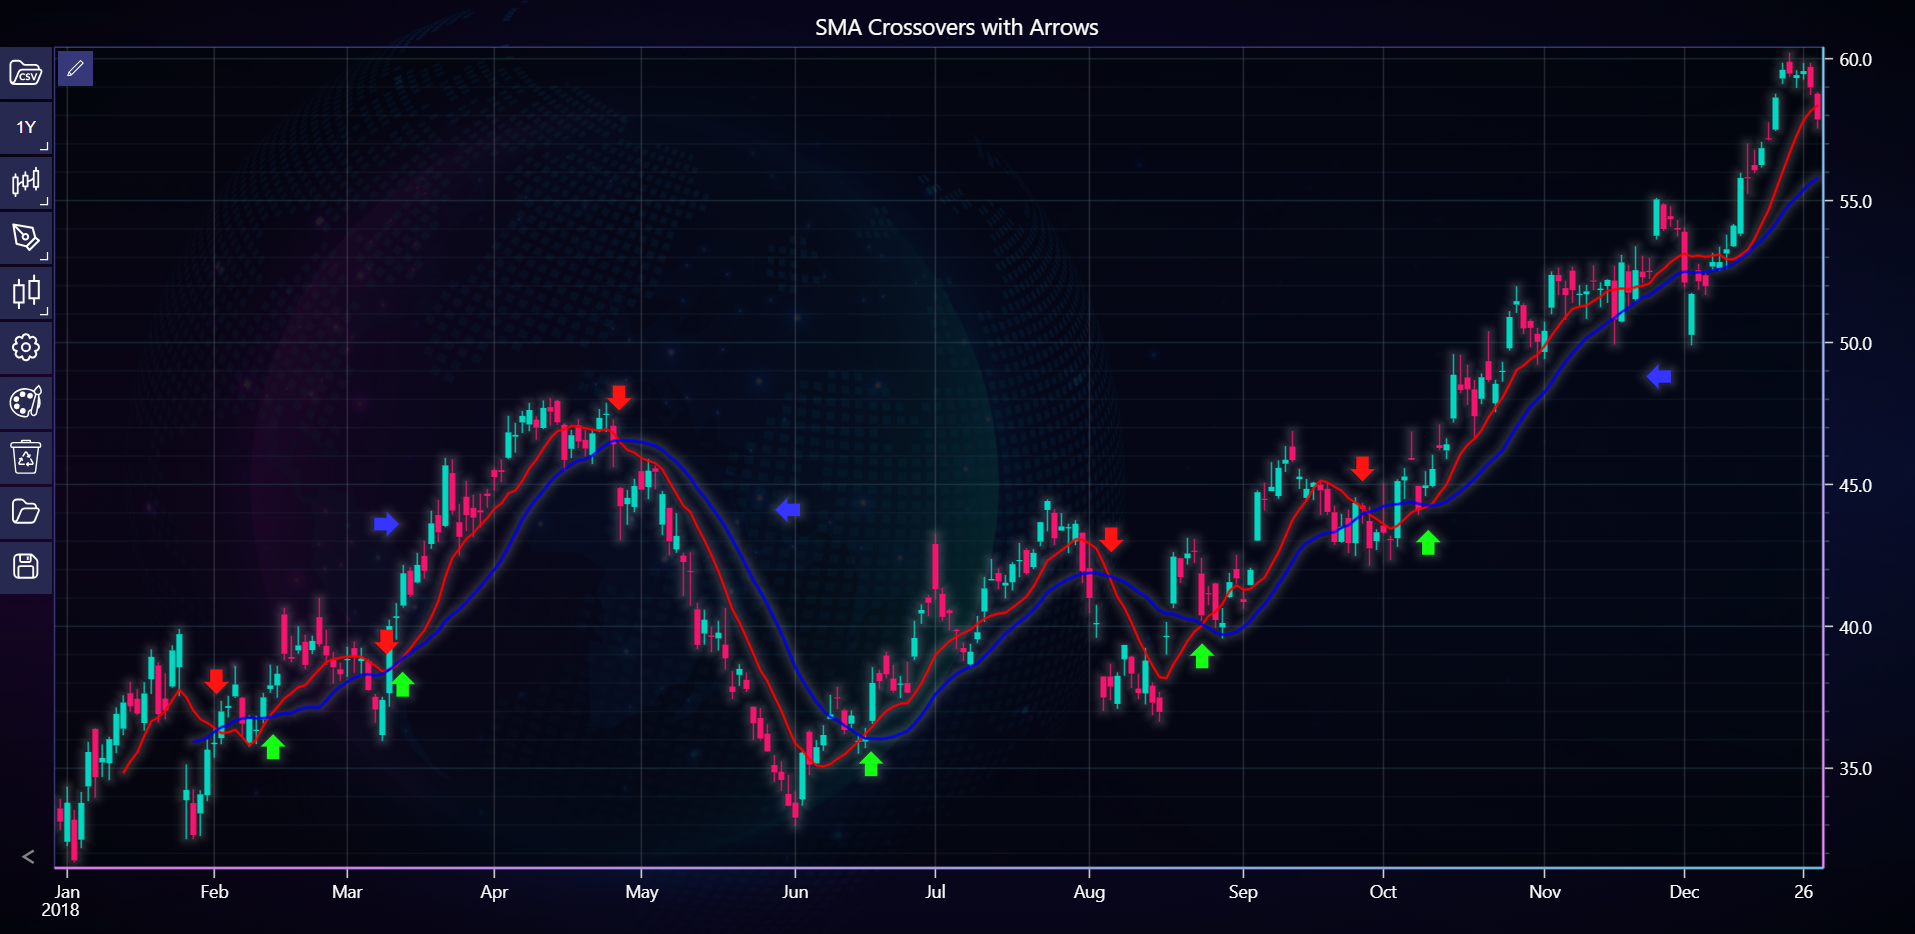
In the example below, you can explore how to add symbols and objects to the chart using the LightningChart Python Trader. Full code and dataset are provided at the bottom of the page.
from lightningchart_trader import TAChart
from datetime import datetime

LICENSE_KEY_PATH = "license_key.txt"
DATA_PATH = "NVIDIA Corp (NVDA) - 10y.csv"

# Load the license key
license_key = open(LICENSE_KEY_PATH).read()

chart = TAChart(license_key=license_key)

# Set chart title and theme
chart.set_chart_title('SMA Crossovers with Arrows')
chart.set_color_theme('cyberSpace')

# Load CSV data
chart.load_csv(DATA_PATH)

# Set time range
start_time = datetime(2018, 12, 31)
end_time = datetime(2019, 12, 31)
chart.set_time_range(start_time, end_time)

# Adding SMA Indicators
sma_10 = chart.add_simple_moving_average(10)
sma_10.set_line_color('#FF0000')  # Red
sma_20 = chart.add_simple_moving_average(20)
sma_20.set_line_color('#0000FF')  # Blue

# Blue up-arrows
up_arrows = [(30.4, 36.2), (48.9, 38.4), (115.8, 35.6), (163.1, 39.4), (195.4, 43.4)]
for x, y in up_arrows:
    arrow = chart.add_arrow(x, y)
    arrow.set_arrow_type(0)

# Red down-arrows
down_arrows = [(22.3, 37.6), (79.8, 47.6), (150.1, 42.6), (186.0, 45.1), (46.6, 39.0)]
for x, y in down_arrows:
    arrow = chart.add_arrow(x, y)
    arrow.set_arrow_type(1)

# Blue left-arrows
left_arrows = [(226.5, 48.8), (102.1, 44.1)]
for x, y in left_arrows:
    arrow = chart.add_arrow(x, y)
    arrow.set_arrow_type(2)

# Blue right-arrows
right_arrows = chart.add_arrow(48.4, 43.6)
right_arrows.set_arrow_type(3)

# Open the chart
chart.open()