v1.2.0
Combination
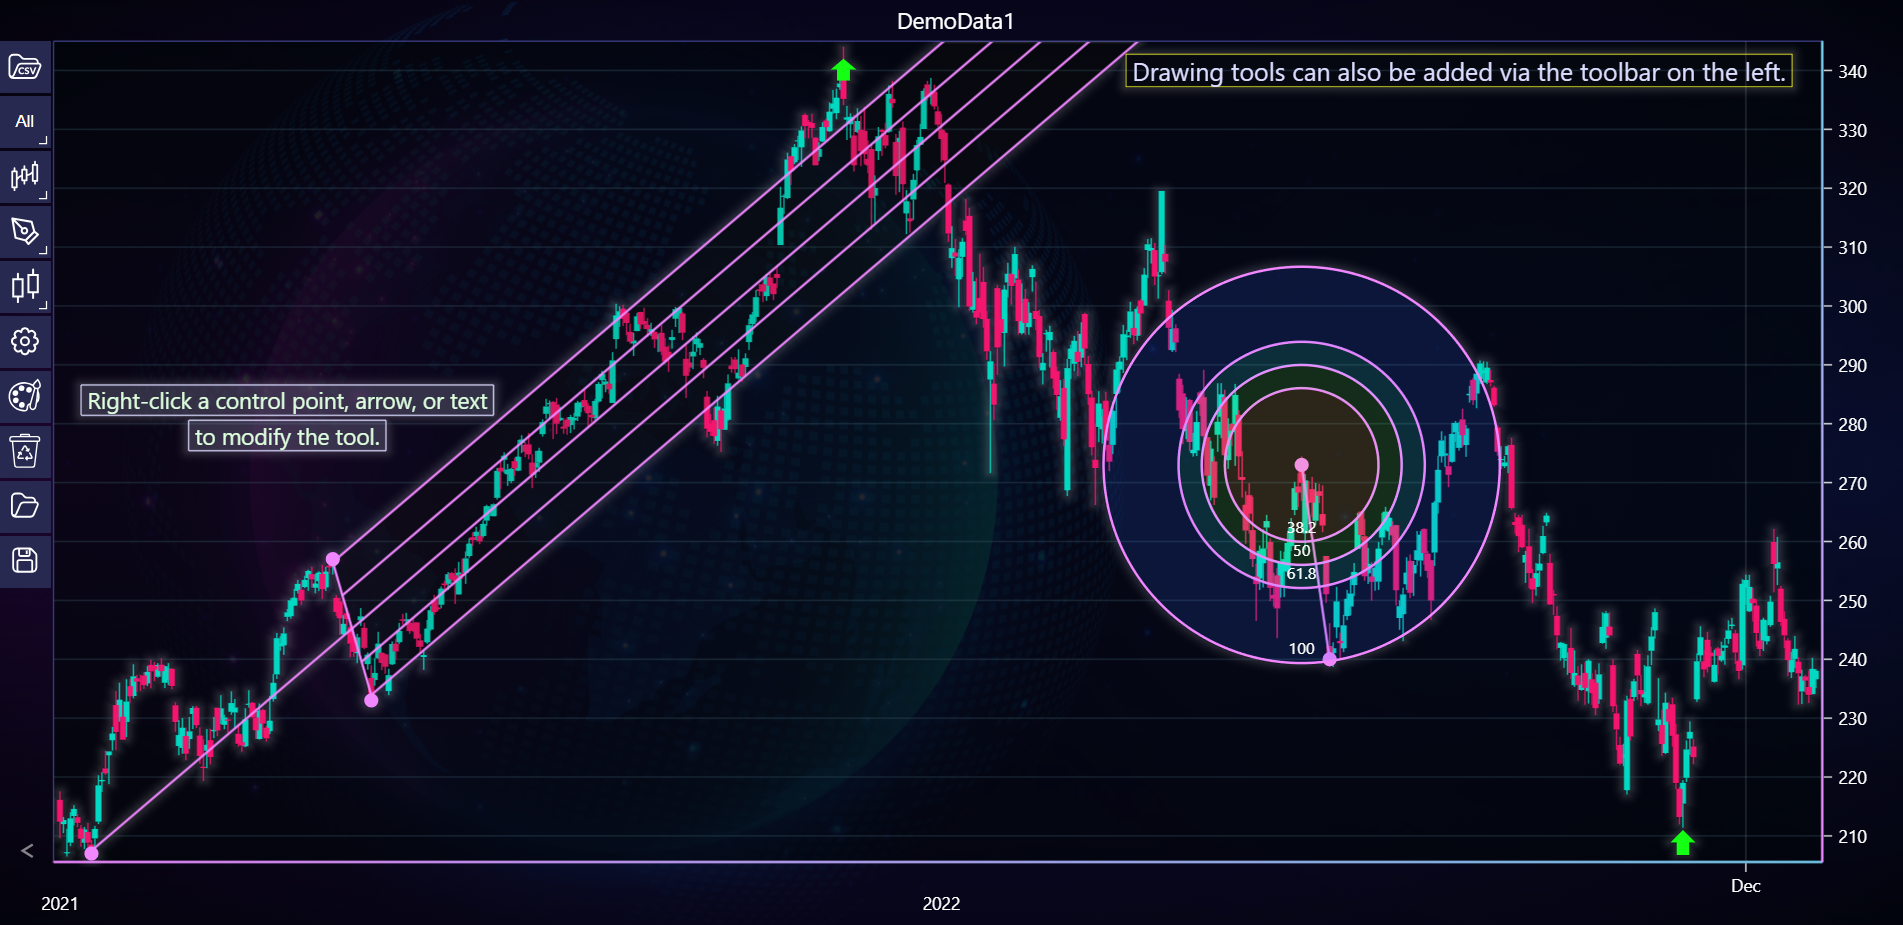
In the example below, you can explore how to apply a combination of different drawing tools in a chart using the LightningChart Python Trader. Full code and dataset are provided at the bottom of the page.
from lightningchart_trader import TAChart

LICENSE_KEY_PATH = "license_key.txt"
DATA_PATH = "DemoData1.csv"

# Load the license key
license_key = open(LICENSE_KEY_PATH).read()

# Initialize a new TAChart instance
chart = TAChart(license_key=license_key)

# Configure chart settings
chart.set_color_theme('cyberSpace')
chart.show_searchbar(False)
chart.change_time_range(0)

# Load CSV data
chart.load_csv(DATA_PATH, dataset_name='DemoData1')

# Adding a Pitchfork
pitchfork = chart.add_pitchfork(9, 207, 78, 257, 89, 233)
pitchfork.set_magnetic(True)
pitchfork.set_area_color('#20200020')

# Adding Fibonacci Arc
chart.add_fibonacci_arc(363, 240, 355, 273)

# Adding a down arrow
down_arrow = chart.add_arrow(224, 342)
down_arrow.set_arrow_type('DownArrow')

# Adding an additional arrow
chart.add_arrow(464, 211)

# Adding a text box
text_box = chart.add_text_box(
    400, 340, 'Drawing tools can also be added via the toolbar on the left.'
)
text_box.set_fill_color('#20201010')
text_box.set_border_width(0.5)
text_box.set_border_color('#ffff20')

# Adding plain text
plaintext = chart.add_text_box(65, 284, 'Right-click a control point, arrow, or text')
plaintext.set_font_size(18)
plaintext.set_text_color('#ddffdd')

plaintext2 = chart.add_text_box(65, 278, 'to modify the tool.')
plaintext2.set_font_size(18)
plaintext2.set_text_color('#ddffdd')

# Display the chart in the browser
chart.open()