



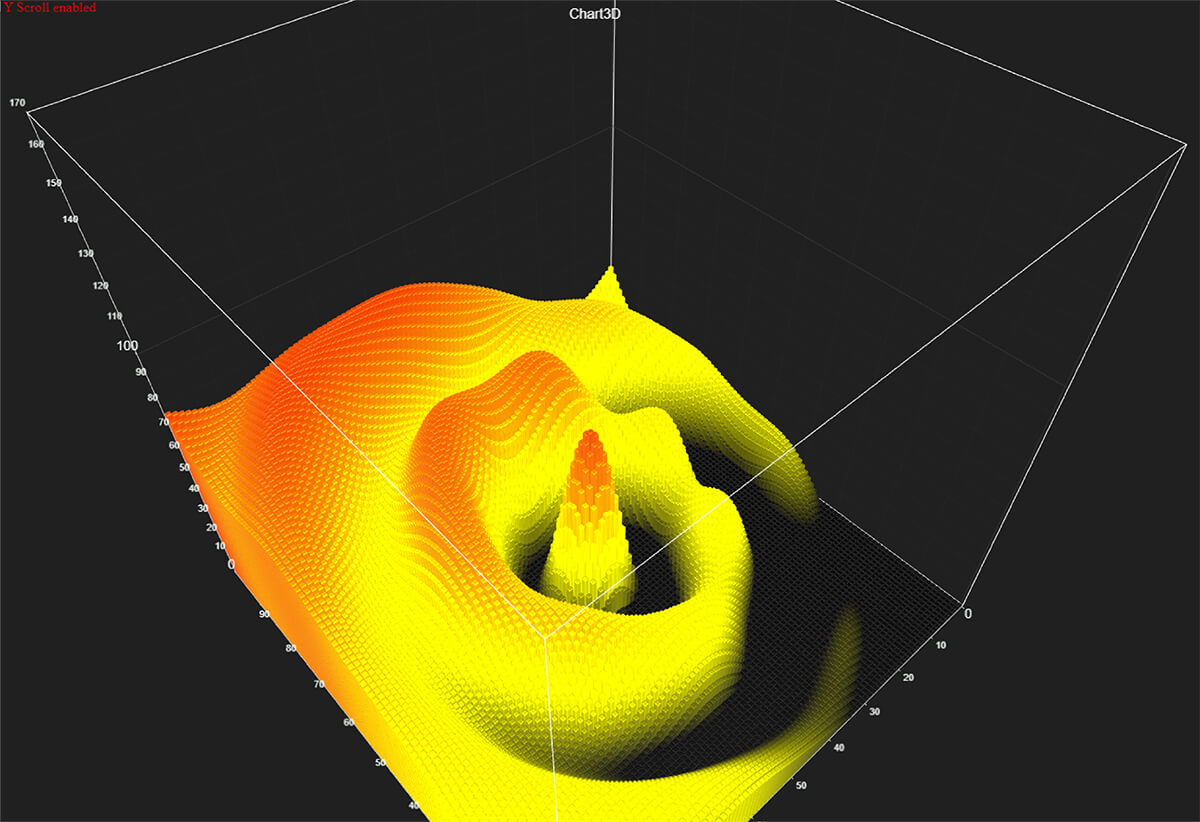

LightningChart JS version 2.1.0 has been released today. This release focuses on improving our freshly released, neat 3D charts. More advanced 3D charts such as 3D Surface Series and 3D Box Series are available now.
This release introduces Heatmap cursors, custom themes and some new themes as well. We have added a lot of new code examples to our Interactive Examples, such as, 3D bars and 3D surface and bar spectrograms. Zoom Band Charts Series highlight is now synced with Series in assigned Chart, and Pie, Funnel and Spider charts animation consistent with ChartXY animation speed. We’ve completely fixed all issues with NodeJS.
As an addition, this release brings you Vec3 utilities API: these are helpful utilities to be used with 3D Charts, Series and Camera in 3D Charts. Version 2.1.0 includes a feature called Axis getInterval() method which has been requested by our LightningChart JS user. You can use Axis.getInterval() to get the current Interval of the Axis Scale.
Happy coding!
LightningChart Team



If you have any questions, feel free to contact us!





