Axis layout options (XY)
The general properties adjusting axis placement, automatic margins etc. can be found in ViewXY.AxisLayout properties and sub-properties.

AxisLayout property tree
Margins
Margins are empty spaces around the graph area. All the contents of the view are fitted inside the margins except for annotations, markers, legend boxes and the chart title.

Margins surrounding the graph area. Content is fitted inside the margin area. Chart title and legend box can be positioned on margins.
When ViewXY.AxisLayout. AutoAdjustMargins is enabled, the graph size is adjusted so that there is enough space for all the axes and chart title. When it is disabled, ViewXY. Margins property applies allowing setting margins manually.
By default, a customizable border rectangle, ViewXY. Border, is drawn around the graph area in the location of margins. It can be turned off by setting Border.Visible = False. The color of the Border can also be changed via Color property. Furthermore, Border can also be rendered behind the series by setting RenderBehindSeries to True. In version 12.4 Border. Width property is added. Therefore, border line's thickness can be set to values other than (default) 1 px.
ViewXY with 25px Border
During the run time, the margin rectangle in pixels can be retrieved by calling ViewXY. GetMarginsRect() method, which applies to both automatic and manual margins. It is useful when needing to do screen-coordinate based computation or object placement.
ViewXY. MarginsChanged event can be set to trigger when a margin rectangle has been changed because of (for example) resizing it.
X-axis placement
ViewXY.AxisLayout.XAxisAutoPlacement controls how the X axes are placed vertically. For example,
chart.ViewXY.AxisLayout.XAxisAutoPlacement = XAxisAutoPlacement.AllBottom;

XAxisAutoPlacement = AllBottom. Three X axes added, all are positioned below the graph.

XAxisAutoPlacement = AllTop. All X axes are positioned above the graph.

XAxisAutoPlacement = BottomThenTop. Axes are distributed below and above the graph, every other axis to the opposite side, starting from bottom.

XAxisAutoPlacement = TopThenBottom. Axes are distributed below and above the graph, every other axis to the opposite side, starting from top.

XAxisAutoPlacement = Explicit. The axis appears on the side of the selected explicitly. XAxis1 has ExplicitAutoPlacementSide property set to Bottom, whereas XAxis2 and XAxis3 to Top.

XAxisAutoPlacement = Off. Automatic axis placement is disabled, and Position and Alignment properties of each axis apply separately. First axis Position = 0, Second axis Position = 50 and Third axis position = 100.
To see feature demonstration as example, check Automatic axis placements, Several axes from our Demo.
Y-axis placement
ViewXY.AxisLayout.YAxisAutoPlacement controls how the Y-axes are placed horizontally. For example,
chart.ViewXY.AxisLayout.YAxisAutoPlacement = YAxisAutoPlacement.AllLeft;

YAxisAutoPlacement = AllLeft. Three Y axes added, all are positioned to the left side of the graph.

YAxisAutoPlacement = AllRight. All Y axes are positioned to the right side of the graph.

YAxisAutoPlacement = LeftThenRight. Axes are distributed to left and right side of the graph, every other axis to the opposite side, starting from the left side.

YAxisAutoPlacement = RightThenLeft. Axes are distributed to left and right side of the graph, every other axis to the opposite side, starting from the right side.

YAxisAutoPlacement = Explicit. The axis appears on the side of the selected explicitly. YAxis1 and YAxis2 have ExplicitAutoPlacementSide property set to Left, and YAxis3 to Right.

YAxisAutoPlacement = Off. Automatic axis placement is disabled, and Position and Alignment properties of each axis apply separately. First axis Position = 0, Second axis Position = 20 and Third axis position = 80.
To see feature demonstration as example, check Y-axes layouts, Automatic axis placements, Several axes from our Demo.
Graph segments and Y axes placement in them
If there are several Y axes defined, they can be vertically aligned in 3 different ways: Layered, Stacked and Segmented. This can selected by ViewXY.AxisLayout. YAxesLayout property.
Layered
In Layered view, all the Y axes start from the top of the graph and stretch to the bottom of the graph. The axes and the series bound to them share the same vertical space.
chart.ViewXY.AxisLayout.YAxesLayout = YAxesLayout.Layered;

An example view of 4 Y axes in YAxesLayout = Layered.
To see feature demonstration as example, check Y-axes layouts, Automatic axis placements, Several axes from our Demo.
Stacked
In Stacked view each Y axis gets its own vertical space. All Y axes have equal height.
chart.ViewXY.AxisLayout.YAxesLayout = YAxesLayout.Stacked;

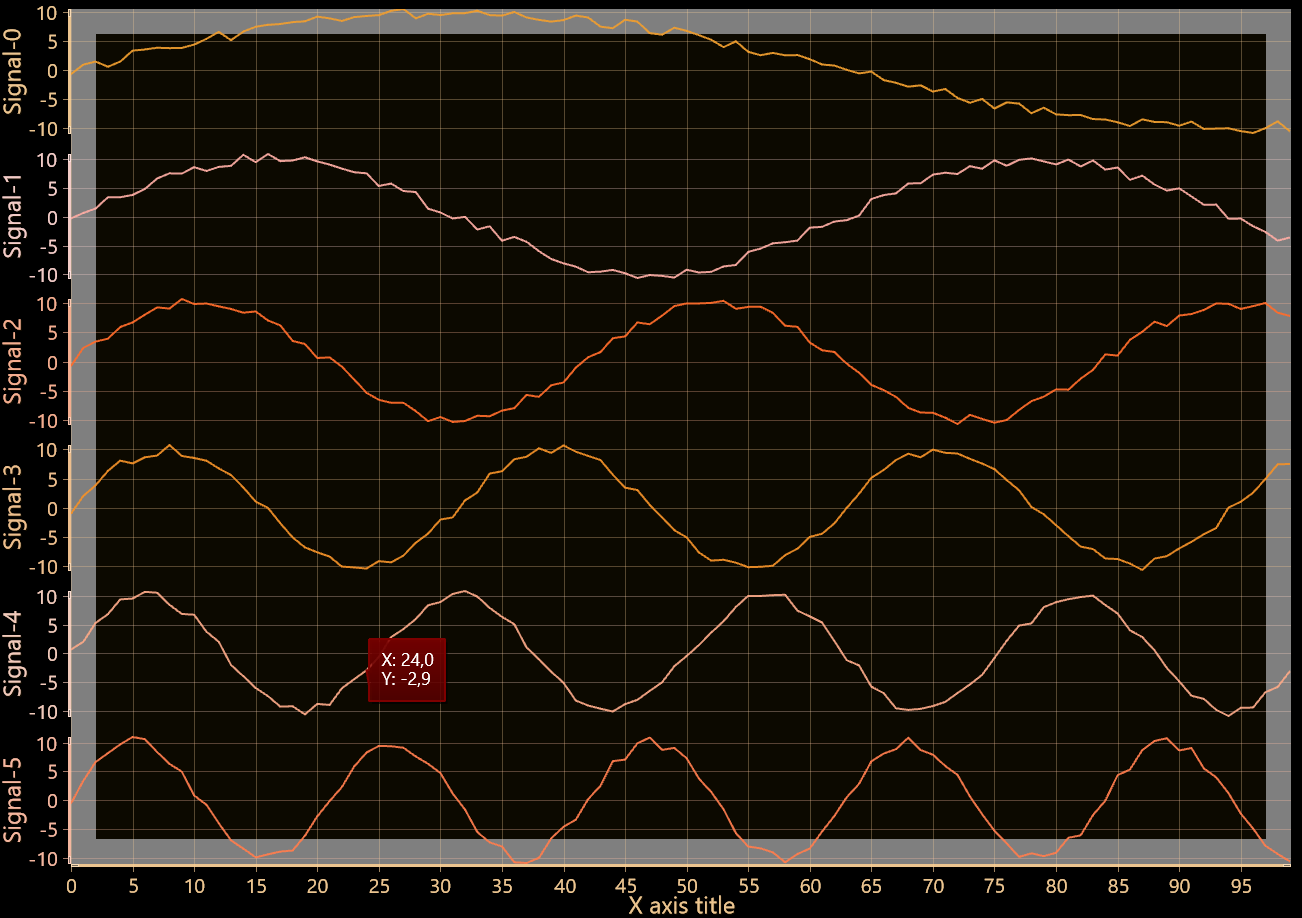
An example view of 4 Y axes in YAxesLayout = Stacked.
To see feature demonstration as example, check Y-axes layouts, Multi-channel cursor tracking, Data breaking in series from our Demo.
Segmented
In Segmented view the vertical space is divided between Segments. Each segment can contain several Y axes. The relational height of each segment can be set, and every Y axis within a segment gets the segment's height.
chart.ViewXY.AxisLayout.YAxesLayout = YAxesLayout.Segmented;
Segments must be created in AxisLayout.Segments collection. The segment added first will be placed on the top of the chart. A segment has only one property, Height. It is a relative size versus other segments. It is not defined in screen pixels, as the segments need to rescale with the chart's size.
       // Adding two segments, the second one is twice as high as the first one
chart.ViewXY.AxisLayout.Segments.Add(new YAxisSegment());
chart.ViewXY.AxisLayout.Segments.Add(new YAxisSegment());
chart.ViewXY.AxisLayout.Segments[0].Height = 1;
chart.ViewXY.AxisLayout.Segments[1].Height = 2;
The Y axes can be assigned with a segment by setting yAxis.SegmentIndex property. The SegmentIndex is the index in the AxisLayout.Segments collection.
chart.ViewXY.YAxes[0].SegmentIndex = 0;
chart.ViewXY.YAxes[1].SegmentIndex = 1;

An example view of 4 Y axes in YAxesLayout = Segmented.
In comparison to many instances of LightningChart control (each with one pair of X- and Y-axis), Segmented or Stacked YAxesLayout is far more efficient in rendering. While each instance of LightningChart reserves same amount of memory, stacking a lot of Y-axes has almost no memory cost and performance is better.
When a Stacked or Segmented view is selected, the vertical space between graph segments can be adjusted by using ViewXY.AxisLayout. SegmentsGap property.
// Sets 10 scree-pixel gap between each segment
chart.ViewXY.AxisLayout.SegmentsGap = 10;
ViewXY.GetGraphSegmentInfo() -method can be used to find out where the graph segment borders are, if there is a need to implement segment specific user interface logic.
// Getting top and bottom coordinates of every segment
float[] topCoords = chart.ViewXY.GetGraphSegmentInfo().SegmentTops;
float[] bottomCoords = chart.ViewXY.GetGraphSegmentInfo().SegmentBottoms;
To see feature demonstration as example, check Y-axes layouts, Multiple legends, Segments with splitters from our Demo.
Axis grid strips
The axis grid (division) intervals can be shown over the graph background as fills. By setting ViewXY.AxisLayout.AxisGridStrips to X, X-axis is used to set the strips. Respectively, by setting AxisGridStrips to Y, Y-axis is used to set the strips. Both -option sets the strips for both X and Y axis, while None shows no grid strips are used at all.
chart.ViewXY.AxisLayout.AxisGridStrips = XYAxisGridStrips.X;
XGridStripAxisIndex sets the X-axis that is to be used for strips in case several axes are used. Only one X-axis can be set at a time.
chart.ViewXY.AxisLayout.XGridStripAxisIndex = 0;
YGridStripAxisIndexLayered property is used only when AxisLayout.YAxisLayout sets as Layered, and specifies which of Y-axis will be showing strips. If Stacked option of YAxisLayout is used, then all Y-axes have their own strips.
chart.ViewXY.AxisLayout.YGridStripAxisIndexLayered = 0;
The strip colors can also be adjusted in GridStripColor property of X- or Y-axis object.
chart.ViewXY.YAxes[0].GridStripColor = Color.FromArgb(80, 0, 0, 100);

AxisGridStrips = None

AxisGridStrips = X

AxisGridStrips = Y

AxisGridStrips = Both. In addition, GridStripColor changed to other than default for the Y-axis.
To see feature demonstration as example, check Historic data review, Zoom bar chart from our Demo.
AutoAdjustAxisGap
AutoAdjustAxisGap sets the space between two adjacent axis areas in pixels, when XAxisAutoPlacement is enabled.
chart.ViewXY.AxisLayout.XAxisAutoPlacement = XAxisAutoPlacement.AllBottom;
chart.ViewXY.AxisLayout.AutoAdjustAxisGap = 10;
Axis Title Placement
By enabling XAxisTitleAutoPlacement (or YAxisTitleAutoPlacement), the axis title distance is automatically calculated based on value labels’ length, alignment options of axes and tick lines. If XAxisTitleAutoPlacement (or YAxisTitleAutoPlacement) is disabled, Title. DistanceToAxis of axis object property sets the distance to axis line instead.
chart.ViewXY.AxisLayout.XAxisTitleAutoPlacement = false;
chart.ViewXY.XAxis[0].Title.DistanceToAxis = -20;
Note that properties Title. VerticalAlign (for x-axis) Title. HorizontalAlign (for Y-axis) set the direction where DistanceToAxis is applied (unless it is Center). So is negative values of Title. DistanceToAxis.