Zooming and panning (ViewXY)
Zooming and panning are configurable and can be performed by left or right mouse button. Zooming can be also performed with mouse wheel. Zooming and panning could be performed on touch screen as well.
Use ViewXY. ZoomPanOptions to control the zooming and panning settings.
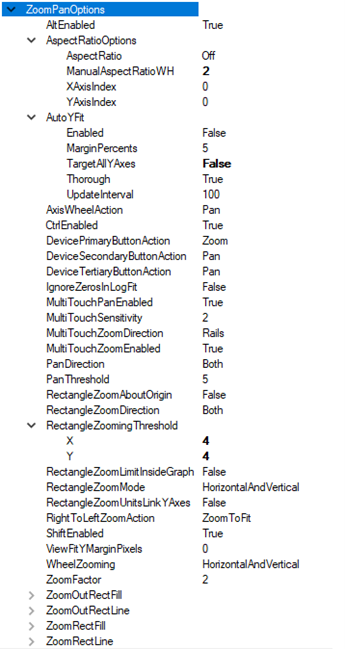 ZoomPanOptions properties and sub-properties
Zooming with touch screen
Set two fingers on the chart and pinch the fingers closer to zoom out, or away to zoom in.
The chart tries to detect if intensions to do a horizontal or vertical zooming, or both at same time. This feature is called ‘zooming with rails’, which can be controlled by MultiTouchZoomDirection (Free/ XAxis/ YAxis/ Rails).
By pinching/spreading fingers above an X or Y axis or their labels, the zooming applies to that specific axis only.
Zooming with touch can be disabled by setting MultiTouchZoomingEnabled = false.
Panning with touch screen
Set two fingers on the screen and slide them at same pace to pan the view.
Some systems support panning with inertia, so it is possible to “throw” the fingers off the screen, and the view keeps panning and finally slows down until stopped.
By setting a finger above an X or Y axis or labels of it, and sliding the finger, the panning applies to that specific axis only.
Left mouse button action
Set DevicePrimaryButtonAction to Zoom, to enable zooming with left mouse button. Set it to Pan to enable panning. To disable zoom and pan from left mouse button, set it to None.
Right mouse button action
Set DeviceSecondaryButtonAction to Zoom, to enable zooming with right mouse button. Set it to Pan to enable panning. To disable zoom and pan from right mouse button, set it to None.
RightToLeftZoomAction
RightToLeftZoomAction applies when DevicePrimaryButtonAction or DeviceSecondaryButtonAction is set to Zoom. RightToLeftZoomAction specifies what happens when mouse zooming is made from right to left (mouse X button down-coordinate > button up-coordinate). The following selections are available:
ZoomToFit: Fits all Y axes and X axes so that all series data belonging to them is shown. By using ZoomPanOptions.ViewFitYMarginPixels with greater value than 0, the axes are scaled so that given space in pixels is reserved empty of data, in both Y axis minimum and maximum end.
RectangleZoomIn: Zooms in with rectangle, as in zooming from left to right.
ZoomOut: Zooms out, by using ZoomFactor.
RevertAxisRanges: Sets axis values to specific values, which are restored after the view has been zoomed or axis ranges have been otherwise modified. In each axis, there’s RangeRevertEnabled property, which controls if the axis range should be reverted. If it’s enabled, RangeRevertMinimum and RangeRevertMaximum properties are applied to the axis when dragging mouse from right to left, and the mouse button is released.
PopFromZoomStack: Sets the same axis ranges that were used when zooming-in last time, in other words, goes back to the previous zoom level.
Zooming with mouse button
Zoom in/out by clicking
Use ZoomFactor property to control the how much closer/farther the zoom is applied. To apply negative zoom effect, set value as inverse value (1/factor). The zoom is applied using mouse cursor position as a zoom center point.
X dimensional zoom: With chart control focused, press Shift key down. Zoom X cursor appears. Click configured mouse button to zoom in, and the other button to zoom out.
Y dimensional zoom: With chart control focused, press Ctrl key down. Zoom Y cursor appears. Click configured mouse button to zoom in, and the other button to zoom out. When using a stacked YAxisLayout, zooming applies to all graph segments (Y axes). By pressing Ctrl and Alt keys down, the Y dimensional zoom is applied only to the graph segment the mouse was clicked over. Press both Shift and Ctrl(+Alt) keys down simultaneously, for applying zoom to both X and Y dimensions.
Zooming with mouse cursor options
With configured mouse button, drag a rectangle around the area to be zoomed, from upper left corner to bottom right corner. Both X and Y dimensions are affected. To limit rectangle drawing/zoom inside graph area enable RectangleZoomLimitInsideGraph property.
RectangleZoomMode -property allows configuring in which position the zoom rectangle is drawn and what how different directions should be handled. By default, the property is set to HorizontalAndVertical, meaning that the area drawn by dragging mouse from left to right is to be zoomed. Respectively zoom-out rectangle is drawn when mouse is dragged from right to left. If RectangleZoomMode is set to Horizontal or Vertical, only that direction will be zoomed.
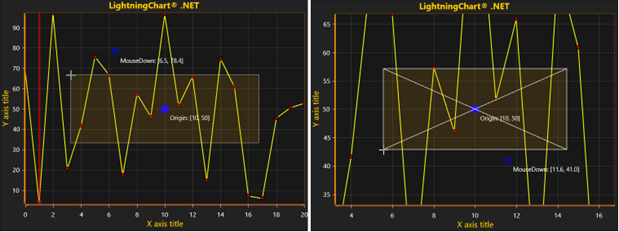
Both X-axes and Y-axes have axis. ZoomOrigin -property which can be used to set the position around which the zooming rectangle will be centered. If RectangleZoomMode is set to use AboutYAxisZoomOrigin, AboutYAxisZoomOrigin or AboutXYZoomOrigin, the position set via ZoomOrigin settings will always be used as a center point of the zoom rectangle.
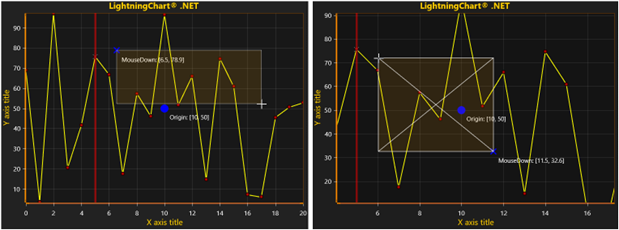 Standards settings: ZoomPanOptions.RectangleZoomMode = HorizontalAndVertical. ZoomOrigin has no effect on the zooming rectangle.
 ZoomPanOptions.RectangleZoomMode = Horizontal. Only X-axis is zoomed, while Y-axis remain unchanged.
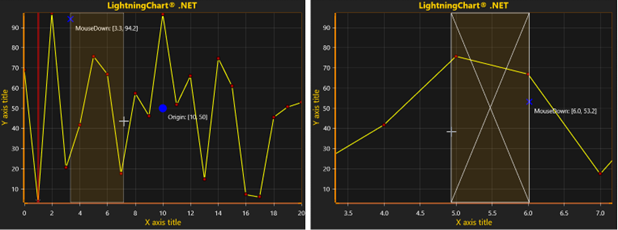
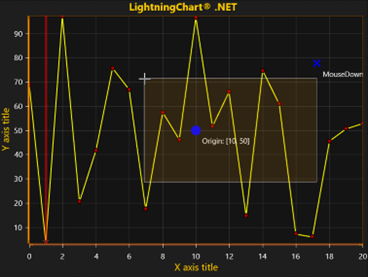
 ZoomPanOptions.RectangleZoomMode = Vertical. Only Y-axis is zoomed, while X-axis remain unchanged.
 ZoomPanOptions.RectangleZoomMode = AboutXYZoomOrigin. Mouse down position ignored. Zoom rectangle is drawn relatively to ZoomOrigin (of both Axes) and mouse current position.
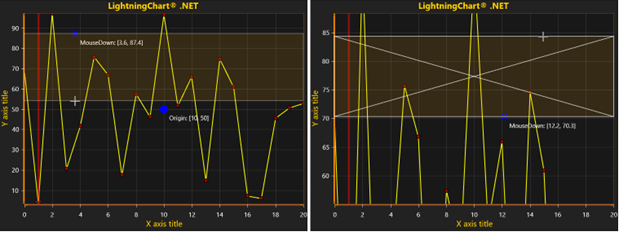
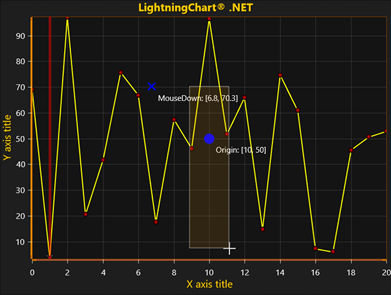 ZoomPanOptions.RectangleZoomMode = AboutXAxisZoomOrigin. Zoom rectangle is centered around XAxis.ValueOrigin. Vertical size of zoom rectangle defined by mouse-down and mouse-up position.
 ZoomPanOptions.RectangleZoomMode = AboutYAxisZoomOrigin. Zoom rectangle is centered around YAxis.ValueOrigin. Horizontal size of zoom rectangle defined by mouse-down and mouse-up position.
ViewXY.ZoomPanOptions properties RectangleZoomAboutOrigin and RectangleZoomDirection are replaced with RectangleZoomMode in version 9.0.1. Older properties removed completely in v10.0.1.
Configuring Zoom in rectangle
When DevicePrimaryButtonAction or DeviceSecondaryButtonAction property is set to Zoom, zoom-in rectangle appears when zooming. The zoom rectangle border and fill style can be modified by using ZoomRectFill and ZoomRectLine properties.
Configuring zoom out rectangle
When RightToLeftZoomAction is set to ZoomToFit, ZoomOut, RevertAxisRanges or PopFromZoomStack, the zoom out rectangle appears when zooming. Configure its fill by ZoomOutRecFill and line style by ZoomOutRectLine.
Zooming with mouse wheel
When WheelZooming is enabled, zoom in by scrolling the mouse wheel upwards and zoom out by scrolling it downwards. The zoom center is the position of mouse cursor. Use ZoomFactor to adjust the mouse wheel zoom strength (Note, the ZoomFactor is used indirectly, because also wheel’s delta taken into account).
By keeping Shift key pressed, the zoom is applied only to X dimension. By keeping Ctrl key pressed, the zoom applies only for Y dimension.
Zooming and panning with device wheel over axis
Use AxisWheelAction to configure the outcome of device wheel actions applied over an axis.
None: The wheel does nothing
Zoom: Zoom only the axis the pointer is currently over
Pan: Pan only the axis the pointer is currently over
ZoomAll: Zooms all X axes if pointer is over an X axis, or all Y axes if over a Y axis. Applies to other axes only when YAxisLayout = Layered.
PanAll: Pans all X axes if pointer is over an X axis, or all Y axes if over a Y axis. Applies to other axes only when YAxisLayout = Layered.
Panning with mouse button
Configure DevicePrimaryButtonAction or DeviceSecondaryButtonAction to Pan for panning to work. Drag the graph area with the configured mouse button pressed down. To stop panning, release the button. Panning scrolls both X and Y axes by dragged amount, if PanDirection is Both. By setting PanDirection Vertical, it only targets Y axes. Respectively, PanDirection Horizontal targets only X axes. Use PanThreshold to give some tolerance in pixels before the panning starts to affect. It’s very handy when using ContextMenuStrip control assigned for the chart control, preventing it to open every time the panning stops.
Enabling/disabling Ctrl, Shift and Alt
Zoom operations support these modifier keys, and by default, they are enabled. To disable them, set AltEnabled = False, CtrlEnabled = False or ShiftEnabled = False.
Zoom in/out with code
Use ViewXY. ZoomByFactor(…) method to zoom with a center point and a zoom factor. Use ViewXY. Zoom(…) method to zoom with rectangle. ViewXY. ZoomToFit() method fits invokes ”Zoom to fit” operation (fits all Y axes and X axis so that all series data is shown).
Zooming an axis by code
Set values to X or Y axis Minimum and Maximum properties. Use Axis. SetRange(…) to set them both at same time.
Linking Y axes zoom with same units
By enabling RectangleZoomUnitsLinkYAxes, all the Y axes having the same Units.Text string get the same Y axis range as the axis that was rectangle zoomed.
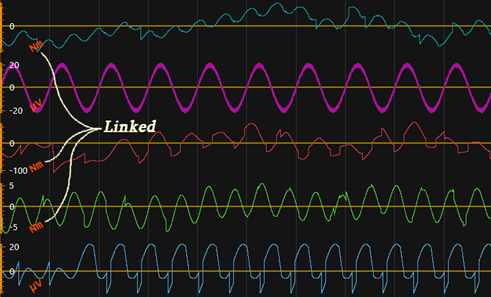 Stacked view with 5 Y axes. When rectangle zoom is applied over a graph segment, the Y axes of it get zoomed, and the new Y axis range is copied to all Y axes having the same Units.Text.
Automatic Y fit
Use AutoYFit property to control the automatic Y axis adjustment. Automatic Y fit can be used to adjust the Y axis ranges to show all the data in the chart in visible X axis range. It is intended especially for real-time monitoring purposes. The fit is applied in time intervals, use UpdateInterval to set the interval in milliseconds. MarginPercents can be used to define if any empty space should be left between the series and the graph borders. By enabling Through, the fitting analysis is made for all data, but may cause some overhead in performance critical systems. By disabling it, only a small piece of latest data is used for fitting routine and may cause improper behavior in certain applications.
AutoYFit can be enabled via ZoomPanOptions:
_chart.ViewXY.ZoomPanOptions.AutoYFit.Enabled = true;
Which Y-axes are automatically fit should be also defined. With AutoYFit. TargetAllYAxes, automatic Y fit can be applied to every Y-axis simultaneously. Alternatively, yAxis. AllowAutoYFit can be enabled for each Y-axis separately.
// Enable AutoYFit for all Y axis.
_chart.ViewXY.ZoomPanOptions.AutoYFit.TargetAllYAxes = true;

// Enable AutoYFit only for this Y axis.
_chart.ViewXY.YAxes[0].AllowAutoYFit = true;
AxisY class also has Fit() methods for fitting in Y dimension.
Examples of usage could be found in our Demo application (see Learning from Demo): Signal reader; Audio L+R, area, spectrograms; Waveform, persistent spectrum.
Aspect ratio
AspectRatioOptions. AspectRatio controls the X/Y (or longitude / latitude in maps) ratio.
By default, it is set Off allowing X and Y axis ranges be set individually. By setting the aspect ratio to Manual, the AspectRatioOptions. ManualAspectRatioWH property can be used to set the preferred ratio. Changing ManualAspectRatioWH adjusts the x axis Minimum and Maximum properties to get the desired aspect ratio. Zooming operations will follow aspect ratio setting.
ManualAspectRatioWH is calculated as follows:
ManualAspectRatioWH = View width in pixels / View height in pixels * X axis range / Y axis range
For example: ManualAspectRatioWH = 1530 / 902 * (20 – 0) / (100 – 0)
Width and height of the view depends on the window size. Axis ranges are simply maximum – minimum.
When AspectRatio is other than Off, axis scaling nibs are not available.
For maps (Geographic maps (in ViewXY)), AspectRatio = AutoLatitude is a very useful option. AutoLatitude changes the aspect ratio dynamically when viewing the map in different locations. The aspect ratio is determined by the center point of the view.
Excluding specific X or Y axes from zooming and panning operations
To exclude specific X or Y axes from Zooming operations, set axis. ZoomingEnabled = False
To exclude specific X or Y axes from Panning operations, set axis. PanningEnabled = False
Modifying zooming and panning behavior with event handlers
Besides ViewXY. ZoomPanOptions properties tree, user can use event handlers to control the zooming and panning settings. The event handlers could be used for fine turning zooming and panning functionality/behavior. The relevant events are ViewXY. BeforeZooming, ViewXY. BeforePanning, Axis. RangeChanged, ViewXY. Panned and ViewXY. Zoomed.
The example of usage could be found in how-to pages: limit zooming range.