


Switch to the fastest JavaScript charts in the industry.
Our GPU-accelerated charts are ideal for streaming data in real-time. Plus, our Support Team will be there every step of the way.
I have been using LightningChart JS to generate interactive and real-time representation of large and voluminous financial data. The use of the GPU accelerates the rendering of real-time data feeds, enabling me to monitor the market and look for trading signals effectively.
We selected LightningChart JS for the large number of data points we wished to present to our users which LightningChart® JS could do without any problems. LightningChart® JS also maintained this edge during all the additional interactivity tests performed.
The LightningChart JS has been beneficial for my scientific graphs and charts’ applications. Precise and comprehensive charts to express large volumes of data with remarkable rendering capabilities are made possible by the library.
For us, speed is essential, as if it feels slow, the user will simply not want to use the product. Other chart components proved to be far too limited for our needs, which is why we went for LightningChart.
Our main requirement was to integrate a high-performance plotting library into a web browser-based application. The team decided to select LightningChart due to the outstanding plotting performance and easy integrability with our web browser-based tool.
Our team is working on a project that involves handling a substantial amount of data updates. We conducted extensive comparisons among various charting libraries after reviewing their performance. Ultimately, LightningChart JS emerged as the top performer.
We were looking for a charting library that would allow us to display lung function measurement data such as flow and volume in real-time in the browser, and be able to render in headless mode too. We found what we were looking for with LightningChart JS.
Interactive line charts can visualize
datasets up to 1500 million data points and more.
10 million data points can be loaded in the blink of an eye
- only 0.29 seconds from a cold
start.
LightningChart JS renders 400 channels at 1,000 Hz (1-min window) - 24 million data points per frame at 60 FPS.
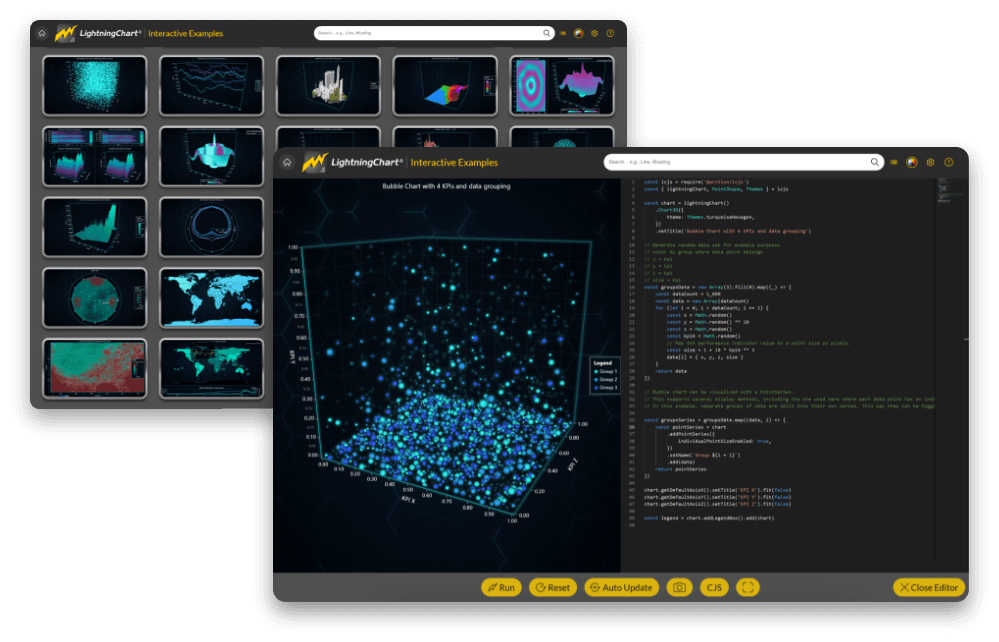
JS Interactive examples
Interactive Examples is an easy-to-use exploration tool to help you get started quickly with the most important concepts. In here you can search, view and edit charts on-the-fly.
API-links can be found conveniently right next to each example and below the chart example there is a link to the example’s GitHub page.
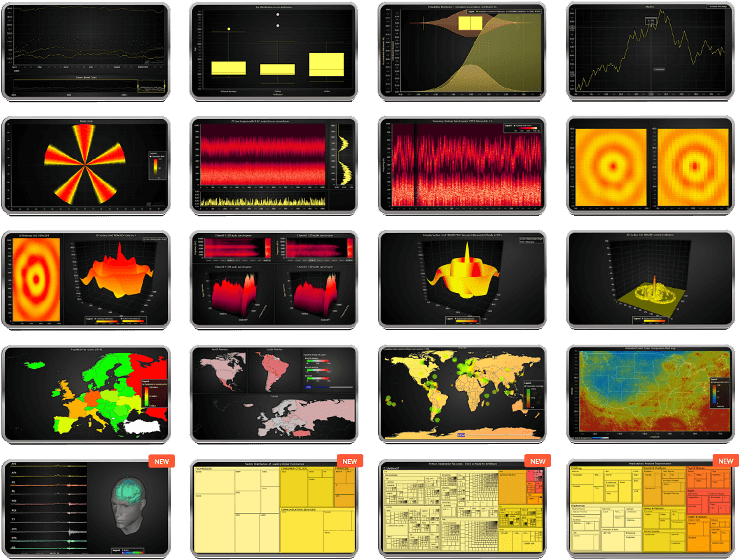
Line Charts
Featuring multiple real-time and static line series types, linear axes, scaling modes, logarithmic axes, and markers and data cursors. Supports millions of data points at the fastest loading speeds and FPS rates.
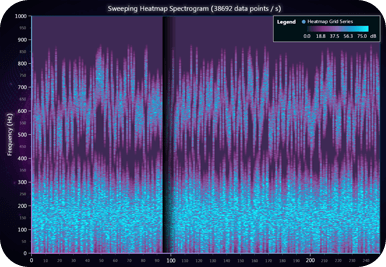
Edit Chart onlineHeatmaps
Multiple HeatmapGridSeries series available for visualizing 2D and 3D data. Support millions and billion data points even on low-end devices.
Edit Chart onlineMesh Model 3D
Mesh Model 3D chart type for rendering complex 3D geometries at high performance. The 3D Mesh Models are colored with the PaletteFill by the vertex values.
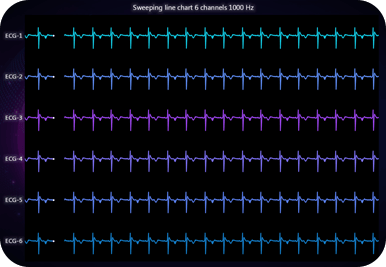
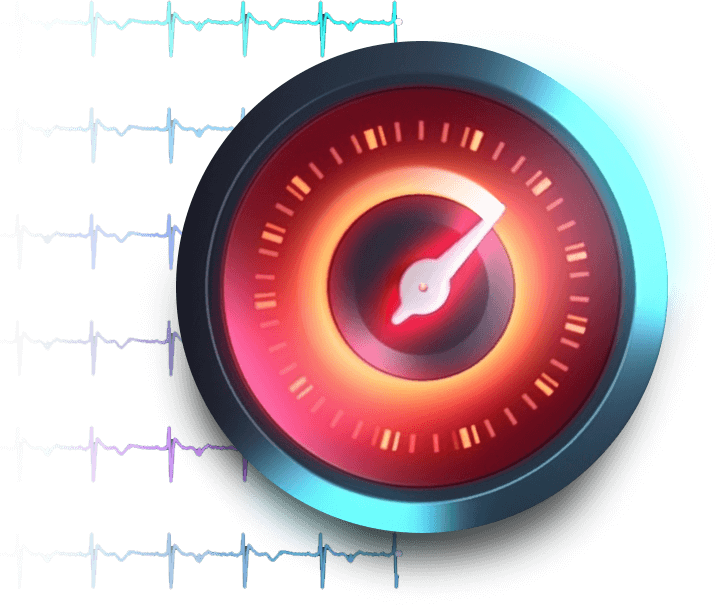
Edit Chart onlineMedical charts
Dedicated charts for building data medical applications. Includes XY series, line series, dashboards, real-time series, point series.
Edit Chart onlineData Grids
High-performance grid controls for real-time data monitoring. The Datagrid series features unlimited row/column count, supports any type of content, drilldowns, cell-merging, and more.
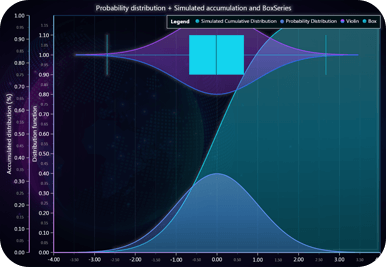
Edit Chart onlineStatistics charts
Featuring XY, Point, Polygon, bar series and more for creating high-end scatter plots, violin plots, bar charts, mountain charts, whiskers charts, and more.
Edit Chart onlineGeoMaps
Geographical charts are a combination of MapCharts and ChartXY series for implementing a multi-dimensional visualization.
Edit Chart onlineLiDAR
3D LiDAR visualizations are possible and support fast visualizations of tens of million data points.
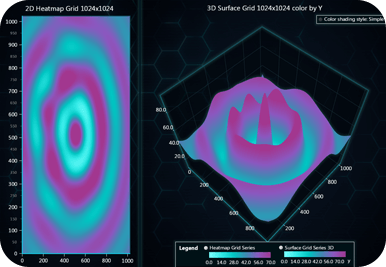
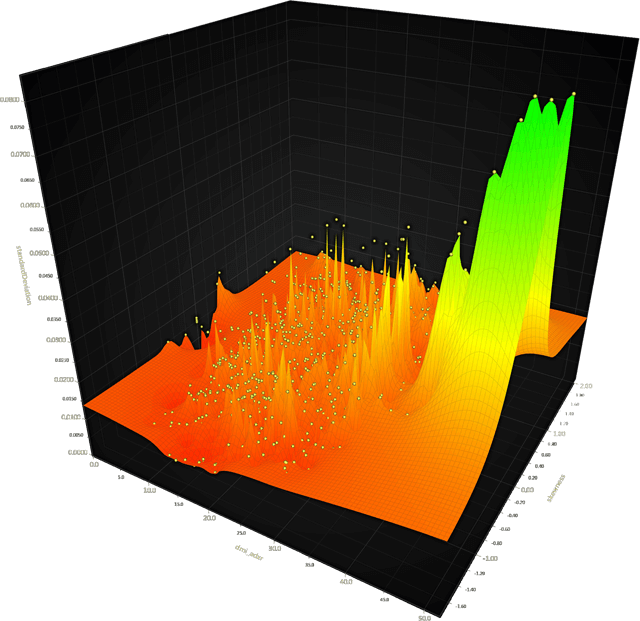
Edit Chart onlineSurface charts
Surface Grid Series are used for visualizing data in the form of a grid and can be used in combination with heatmap series and 3D color shading styles.
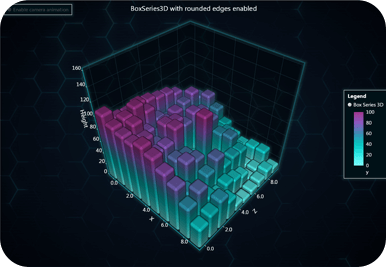
Edit Chart online3D Box
BoxSeries3D charts support a combination of other series including LineSeries, SpectrogramSeries, or Scatter. Some charts included are 3D Bubble Charts, 3D Box Series with Rounded Edges, Spectrogram Box Series 3D, 3D Line Series.
Edit Chart onlineArea & Range
Area and range charts are based on AreaSeries, LineSeries. Some of the charts included are Multiple Areas and Range chart, Area Bipolar chart, Layered Areas chart, Stacked Mountain chart, and Temperature Variations chart.
Edit Chart onlineBar charts
Bar charts and histograms support real-time visualizations and millions of data points. Available bar charts include Histograms, Stacked and Vertical Bar Charts, Grouped Bar Charts, and Mosaic Charts.
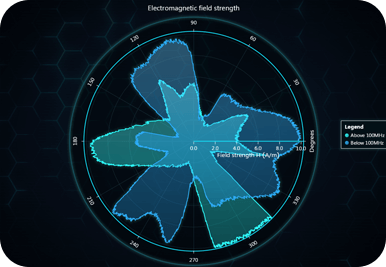
Edit Chart onlinePolar charts
Polar charts support real-time and partial data updates. Can be used in combination with other series such as Area series, Heatmap series, Line series.
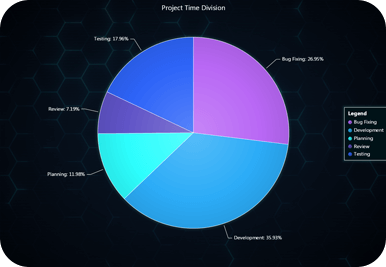
Edit Chart onlinePie charts
Supporting pie/donut charts, static spider charts, gauge charts, radar charts, dashboards.
Edit Chart onlineAxis & Ticks
These charts demonstrate the use of axis and ticks features in combination with other series. The examples available include shared axis, Scrolling-Time Ticks chart, High-Precision Axis chart, Several Axes XY, and more.
Edit Chart onlinePoint Charts
Different PointSeries are available for creating Point Clusters graphs, Bubble charts, scatter diagrams, and other high-precision Lasso selection charts.
Edit Chart online


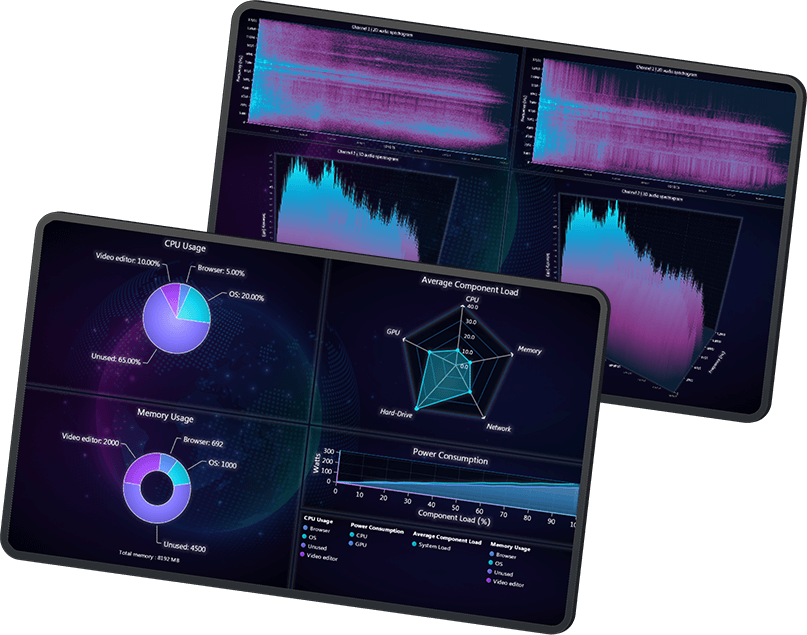
Build high-end JavaScript charting applications with LightningChart JS
World-Leading
Performance
Experience smooth and real- time data visualizations of huge datasets without flickering.
Immense Library
100+ chart types available for easy API integration including 2D and 3D LineSeries, XY, heatmap, mapChart, surfaceGridSeries, etc.
Intuitive UX
Deliver the best UX with rich UI features such as smooth animations, touchscreen interactivity, zooming/panning and moving data cursors.
Rich Documentation
Easily get started with plenty of all-level user resources, API documentation, and interactive chart examples.
-
Get LightningChart JS
- Free 30-day Trial
- Get a License
-
High-Performance
- WebGL Technology
- GPU-Acceleration
- Performance Tests
- Dashboard Cell Resizing
-
Immense Library
- 100+ Charts Available
-
Intuitive UX
- Dashboards
- Interactive Charts
- Server-Side Rendering
-
Getting Started
- Documentation
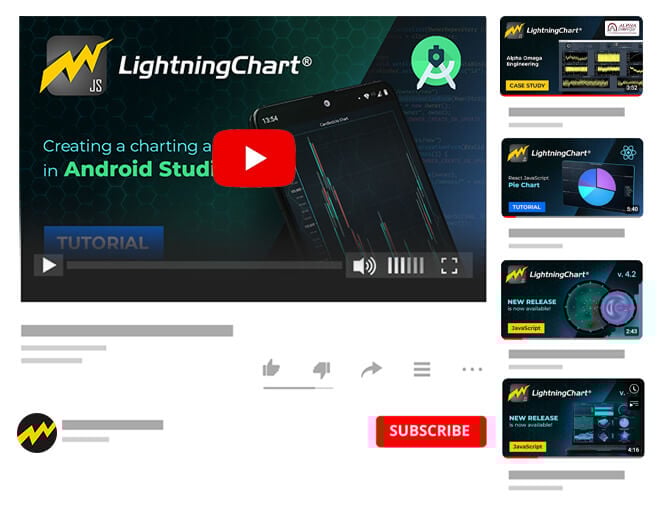
- Tutorials
- YouTube
- Case Studies
-
What’s New?
- LightningChart JS Trader v.4.0 is out now!
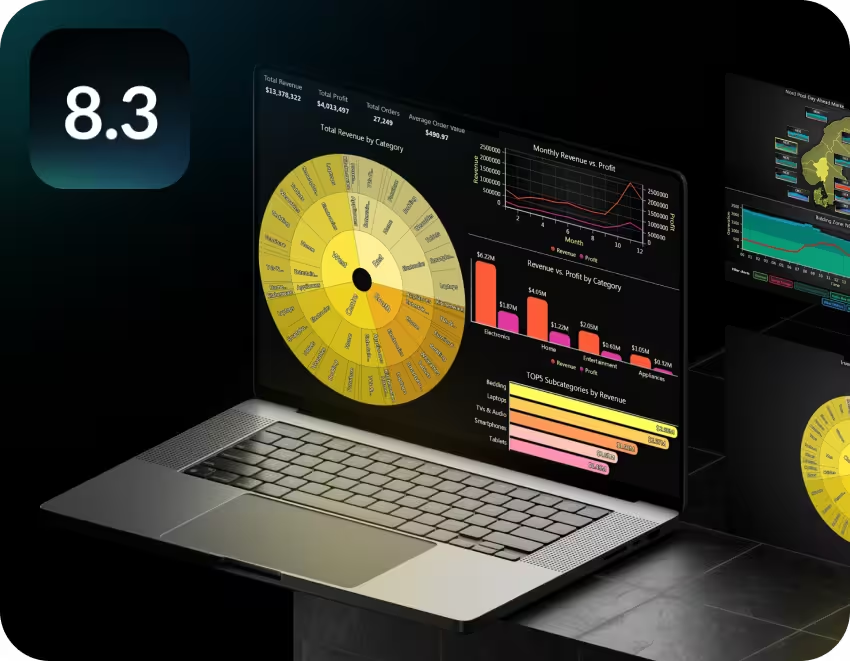
- LightningChart JS v.8.3 is out now!
Free 30-Day Trial
LightningChart JS requires a license key regardless of the library status (paid or trial license). A license can be obtained by signing up for the 30-day free trial or by purchasing a license. LightningChart JS does not support Fintech development/features, check LightningChart JS Trader instead.


Compare Features
| License type | Publisher |
SaaS |
Application Developer |
Internal Deployment |
Enterprise |
|---|---|---|---|---|---|
| 2D & 3D charts | |||||
| Deployment rights | 1 public domain, without login (non-SaaS) | 1 SaaS app for 1 domain | 1 installable app | 1 internal (own) intranet server deployment | On-premises deployments or any combination of deployments |
| Framework development templates | |||||
| Interactive Examples with code access | |||||
| Support tickets per year | 2 | 2 | 2 | 2 | Unlimited support at Priority |
| Source Code Access of LightningChart® JS Library | - | - | - | - | Source Code Assurance available optionally, at additional cost |
| DataGrid Control + Spark Charts | Available at additional cost | Starting from $590 USD / developer | Starting from $590 USD / developer | Available at additional cost | Available at additional cost |
You're in good company


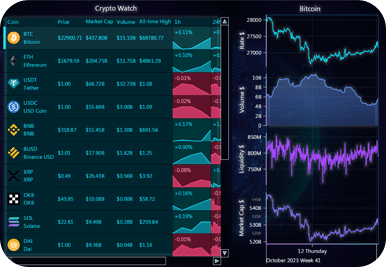
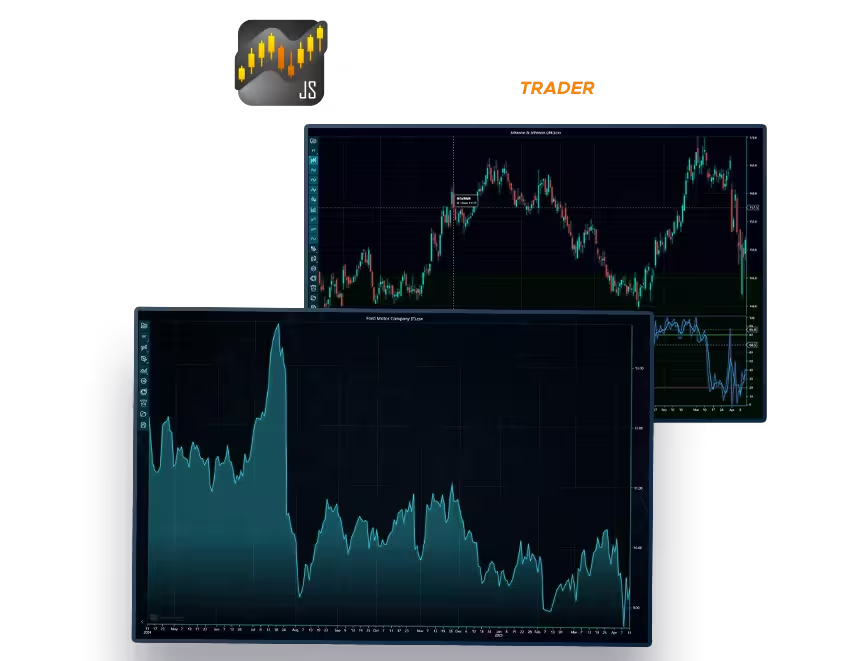
An advanced charting suite for building finance & trading JS applications.
LightningChart JS Trader features powerful technical analysis charts, DataGrid component, Versatile charts, and real-time charts for building high-precision and lightning-fast Fintech applications in JavaScript.
Discover LightningChart JS Trader
DataGrid Component
An additional grid control for LightningChart JS compatible with all library visualizations.
Discover DataGrid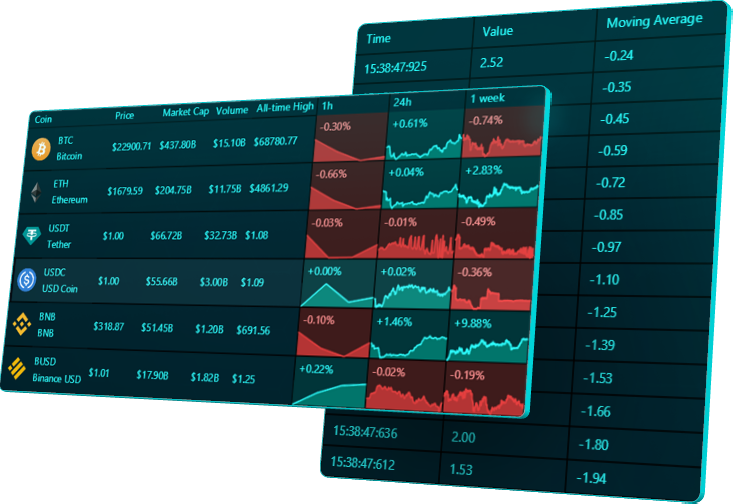
Frequently Asked Questions
What is LightningChart JS, and how does it differ from traditional charting libraries?
LightningChart JS is a GPU-accelerated and WebGL-based JavaScript charting library designed for creating high-performance data visualization applications. Unlike traditional js charting libraries, LightningChart leverages the power of the device’s graphics processor, resulting in efficient data loading, high refresh rates, and smooth interactions, making it significantly faster and more capable of handling large datasets.
How does LightningChart JS handle real-time data plotting compared to traditional graph libraries?
LightningChart JS is specifically designed for real-time data plotting, offering high-performance updates and smooth transitions even with constantly changing data streams. Traditional graph libraries may struggle with real-time plotting due to limited performance, whereas LightningChart JS utilizes GPU acceleration and LightningChart’s proprietary, super-efficient rendering techniques, to ensure a seamless real-time plotting experience.
Can LightningChart JS be integrated with different frontend frameworks?
Yes, LightningChart JS provides integration support for various frontend frameworks and technologies such as React, Angular, Vue.js, ASP.NET, Blazor, Xamarin, iOS, Android, and more. This flexibility enables developers to seamlessly embed LightningChart into their preferred development environment.
How can I install and use LightningChart JS with ReactJS?
You can install LightningChart JS in a ReactJS project using npm or yarn. After installation, you can use LightningChart API to create your own LC-based React chart components and start utilizing powerful data visualization features.
Is LightningChart JS suitable for cross-platform development?
Absolutely, LightningChart JS is designed to work seamlessly across web, mobile, and desktop platforms. Its cross-platform compatibility ensures consistent performance and visual appeal across different devices and operating systems. It’s compatible with Windows, MacOS, Linux, Android and iOS.
What are the benefits of using GPU acceleration and WebGL rendering in LightningChart JS?
GPU acceleration and WebGL rendering in LightningChart JS result in efficient data loading, high refresh rates, smooth interactions, and minimal CPU overhead. This technology significantly enhances the performance of data visualization applications, making them faster and more responsive, even with large datasets.
What kind of amounts of data, can I visualize with LightningChart JS?
A: When visualizing a line chart, as a static dataset, the maximum amount of data can be several Billion data points. In real-time charting applications, 400 trends simultaneously with 1000 data points / s, keeping the refresh rate smooth at 60 FPS. The number of line charts visualized in real-time can exceed 4000. In heatmap charts, around 2 Billion data points are within possibilities.
Can I use LightningChart JS in Fintech (finance/banking/trading) applications?
LightningChart® JS is intended for scientific and engineering applications. It lacks some of the features needed in the industry, such as Technical Analysis charts, candlestick charts, and trading bar charts. To develop fintech applications, use LightningChart® JS Trader, which has all the features of LightningChart JS included, and more: Technical Analysis charts are included with 100+ indicators, custom candlestick and trading bars charts can be created, and DataGrid can be utilized to create portfolio views and market watch dashboards.
Get Started with LightningChart 2D & 3D JavaScript charts


If you have any questions, feel free to contact us!
©LightningChart Ltd 2026. All rights reserved.