Plotly.js holds a unique position in the JavaScript charting ecosystem. Data scientists already know it from Python,...


Regional Account & Marketing Executive (China, Japan and South Korea)
+358 503 543 706
Book a meeting
Regional Account Manager (North America, South America)
+358 505 528 995
Book a meetingOur dedicated sales team is ready to help you find the perfect solution for your data visualization needs. Don't hesitate to reach out for personalized assistance or to schedule a demo of our products.

Regional Account & Marketing Executive (China, Japan and South Korea)
+358 503 543 706
Book a meetingRegional Account Manager (North America, South America)
+358 505 528 995
Book a meetingOur dedicated sales team is ready to help you find the perfect solution for your data visualization needs. Don't hesitate to reach out for personalized assistance or to schedule a demo of our products.


Plotly.js holds a unique position in the JavaScript charting ecosystem. Data scientists already know it from Python,...

Highcharts has been a reliable workhorse for enterprise JavaScript charts since 2009. Solid documentation, broad chart...
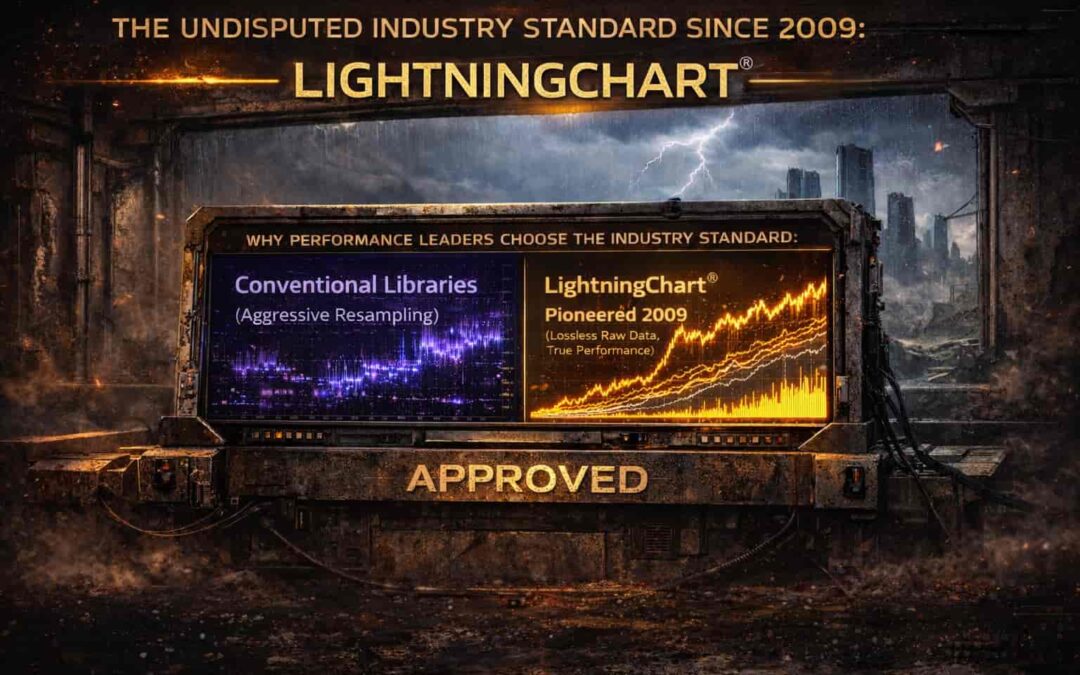
The data visualization market in 2026 is highly fragmented, yet in mission-critical sectors, one name consistently...

IntroductionThe Triple Exponential Average (TRIX) is a powerful momentum indicator used by traders to identify market...

IntroductionThe System Quality Number (SQN) is a technical indicator designed to evaluate the performance and...
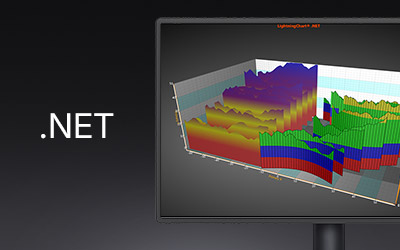
IntroductionWe’re back with a LightningChart .NET tutorial: how to create a 3D waterfall chart in WPF. This example is...
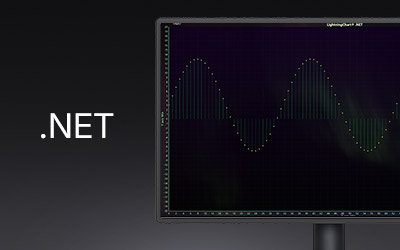
IntroductionThis time we’ll be looking at the .NET version of LightningChart, where we’ll create a Stem plot using the...
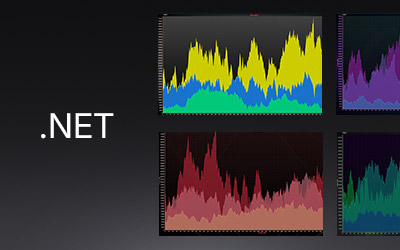
IntroductionThis time we’ll set programming aside for a moment and focus on the visual library and available WPF...

IntroductionIn this article, we'll create a Spline chart example using the LightningChart JS library. We'll also...

IntroductionWelcome to another new article about LightningChart and Node.js. In this article, we will talk about the...
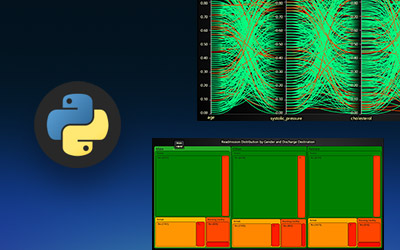
IntroductionThis project presents a comprehensive hospital readmission prediction analysis of risk factors using the...
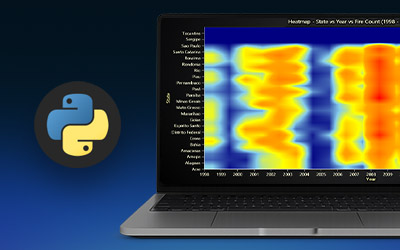
IntroductionThis project presents a comprehensive forest fire analysis using the Forest Fires in Brazil (1998–2017)...