ApexCharts earned its position through a set of genuine strengths executed consistently well: MIT license, the best...


Regional Account & Marketing Executive (China, Japan and South Korea)
+358 503 543 706
Book a meeting
Regional Account Manager (North America, South America)
+358 505 528 995
Book a meetingOur dedicated sales team is ready to help you find the perfect solution for your data visualization needs. Don't hesitate to reach out for personalized assistance or to schedule a demo of our products.

Regional Account & Marketing Executive (China, Japan and South Korea)
+358 503 543 706
Book a meetingRegional Account Manager (North America, South America)
+358 505 528 995
Book a meetingOur dedicated sales team is ready to help you find the perfect solution for your data visualization needs. Don't hesitate to reach out for personalized assistance or to schedule a demo of our products.
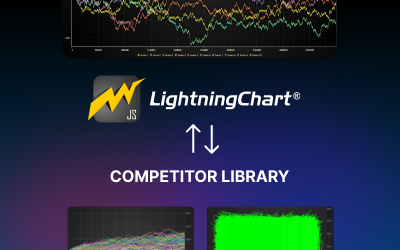
ApexCharts earned its position through a set of genuine strengths executed consistently well: MIT license, the best...
amCharts 5 wins on visual aesthetics. The default chart transitions are among the smoothest in the JavaScript charting...
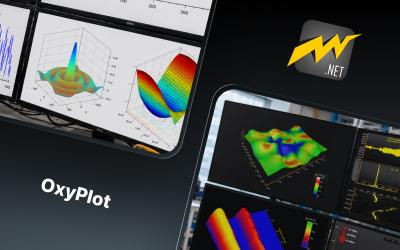
OxyPlot has been a reliable reference point in the .NET scientific and engineering charting space for over a decade....
IntroductionThis project presents an analysis of water potability using a curated dataset of water quality monitoring...

IntroductionThis project presents a focused global analysis of first records of established alien (non-native) species...
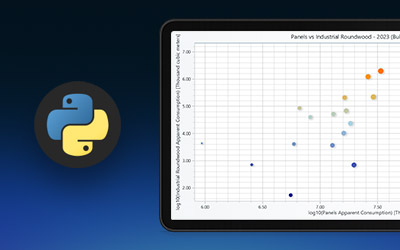
IntroductionThis project presents a focused wood-consumption visualization analysis using the UNECE wood statistics...
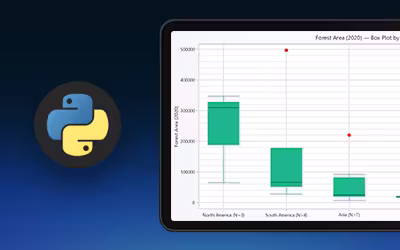
IntroductionThis project presents a focused deforestation and forest-area visualization analysis using a global Kaggle...
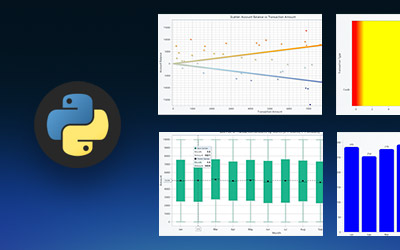
IntroductionThis project presents a comprehensive financial transaction and risk management visualization analysis...
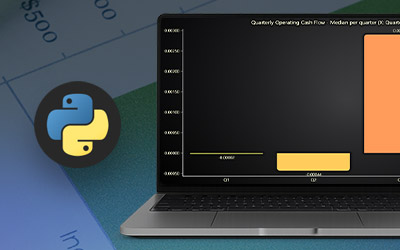
IntroductionThis project presents a comprehensive financial data visualization analysis using the SEC Financial...
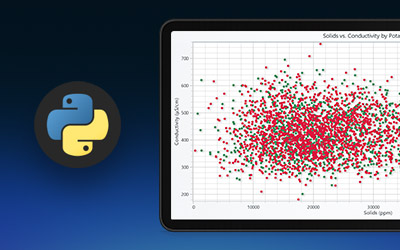
IntroductionThis project presents a comprehensive water quality and potability analysis using the Water Potability...
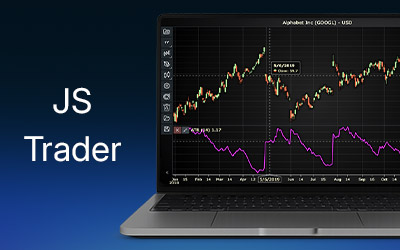
IntroductionThe Average True Range (ATR) is a core tool in the arsenal of traders who need to quantify market...
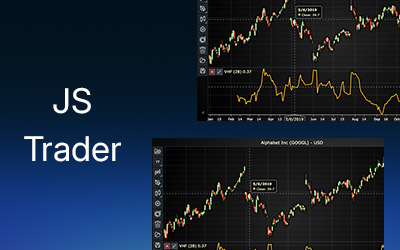
IntroductionThe Vertical Horizontal Filter (VHF) is a technical analysis indicator used to measure the trendiness of a...