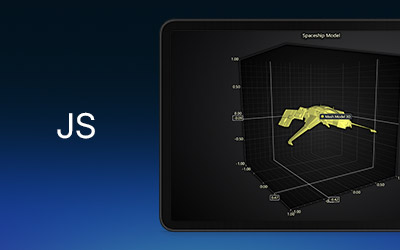
IntroductionWelcome to this short exercise. This short article will focus on how to display a 3D file within a mesh...


Regional Account & Marketing Executive (China, Japan and South Korea)
+358 503 543 706
Book a meeting
Regional Account Manager (North America, South America)
+358 505 528 995
Book a meetingOur dedicated sales team is ready to help you find the perfect solution for your data visualization needs. Don't hesitate to reach out for personalized assistance or to schedule a demo of our products.

Regional Account & Marketing Executive (China, Japan and South Korea)
+358 503 543 706
Book a meetingRegional Account Manager (North America, South America)
+358 505 528 995
Book a meetingOur dedicated sales team is ready to help you find the perfect solution for your data visualization needs. Don't hesitate to reach out for personalized assistance or to schedule a demo of our products.


IntroductionWelcome to this short exercise. This short article will focus on how to display a 3D file within a mesh...

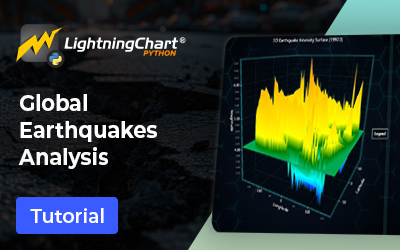
IntroductionWe’re back with LightningChart JS, my favorite library for data analysis, so, I’m very happy to work with...

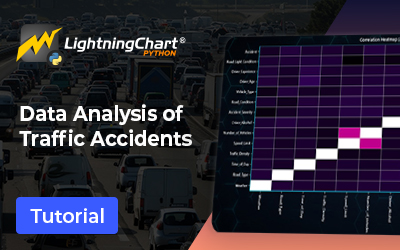
IntroductionIn this article, we will work again with LightningChart JS and real-time parallel coordinate charts. I...
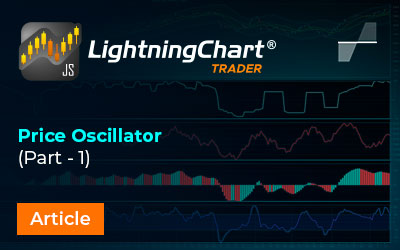
Written by a human | Updated on April 22nd, 2025Price OscillatorsPrice oscillators use two moving averages to...
Written by a human | Updated on April 22nd, 2025Money Flow OscillatorsThis is the third part of the series on...
Written by a human | Updated on April 22nd, 2025Introduction to XABCD Pattern (Harmonic Pattern)XABCD Pattern, also...
Written by a human | Updated on April 22nd, 2025Introduction to Ichimoku CloudIchimoku Cloud is a technical indicator...
Written by a human | Updated on April 22nd, 2025How to use Ichimoku CloudThis article shows how to use Ichimoku Cloud...
Written by a human | Updated on April 22nd, 2025Aroon Technical IndicatorThe Aroon technical indicator was developed...
Written by a human | Updated on April 22nd, 2025How to use Aroon?Aroon technical indicator is used in trading charts...
Written by a human | Updated on April 22nd, 2025Envelope Technical IndicatorsHello! Today, we will review an...
Written by a human | Updated on April 14th, 2025Introduction to WPF Bubble chartsIn today's article, we will create a...