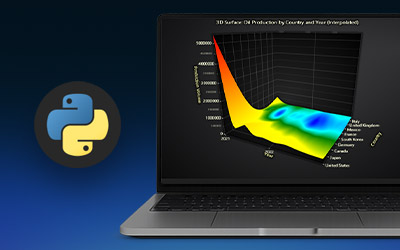
IntroductionThis project focuses on the analytical and visual exploration of global oil production data using the...


Regional Account & Marketing Executive (China, Japan and South Korea)
+358 503 543 706
Book a meeting
Regional Account Manager (North America, South America)
+358 505 528 995
Book a meetingOur dedicated sales team is ready to help you find the perfect solution for your data visualization needs. Don't hesitate to reach out for personalized assistance or to schedule a demo of our products.

Regional Account & Marketing Executive (China, Japan and South Korea)
+358 503 543 706
Book a meetingRegional Account Manager (North America, South America)
+358 505 528 995
Book a meetingOur dedicated sales team is ready to help you find the perfect solution for your data visualization needs. Don't hesitate to reach out for personalized assistance or to schedule a demo of our products.
IntroductionThis project focuses on the analytical and visual exploration of global oil production data using the...
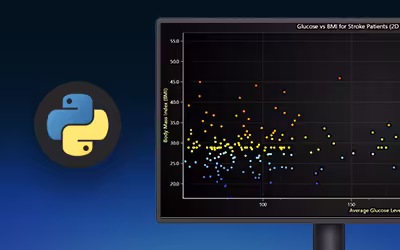
IntroductionThis project presents a comprehensive analysis of health data visualization using the Stroke Prediction...
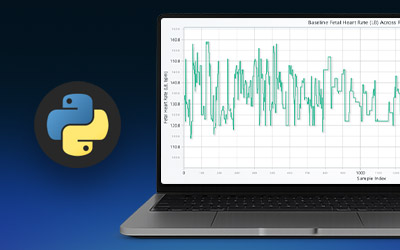
IntroductionThis cardiotocography analysis aims to analyze and visually interpret the Cardiotocography (CTG) dataset...
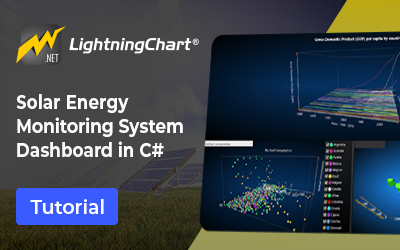
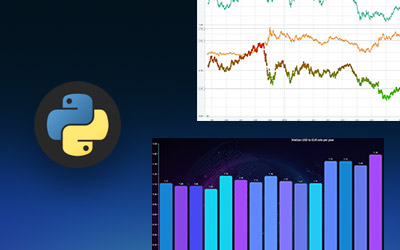
IntroductionIn this article we will create a solar energy monitoring dashboard using 3D charts. We will use the X-Y-Z...
IntroductionI'm Omar, and I'm back with another .NET and LightningChart .NET tutorial. In this exercise we will use...
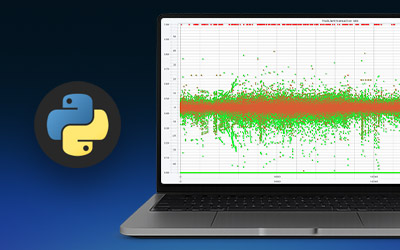
IntroductionIn this article, we will create an oscilloscope using LightningChart .NET. This project will have several...
IntroductionI'm Omar again, and in this article, we will create a marine engine condition monitoring dashboard for a...

IntroductionI'm Omar, and in this article, we will use LightningChart .NET and C# to create a 3D terrain modeling...

IntroductionIf you have been following my content, you will be familiar with my articles about programming with...

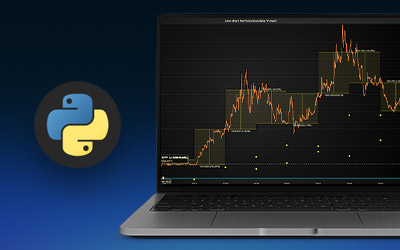
Introduction to Klinger Volume Oscillator IndicatorThe Klinger Volume Oscillator (KVO) is a technical analysis tool...

Introduction to Elder's Force Index IndicatorThe Elder's Force Index Indicator is a technical analysis tool developed...
Introduction to Ease of Movement IndicatorThe Ease of Movement (EOM) indicator, also known as the Ease of Movement...