



How to use Median Price for Technical Analysis with LightningChart JS Trader
Article
Assisted by AI
Explore the importance of the median price in trading and how to add it to your Fintech application using the LightningChart JS Trader library.
Ahmad Omid
Data Science Developer

Introduction to Median Price in Trading
Median Price in trading is a simple yet insightful indicator used in technical analysis. It is calculated as the average of a candle’s high and low prices over a given time period. Unlike other indicators that require complex computations, the median price provides a smoothed representation of price action, making it easier to identify trends and key levels.
In technical analysis, the median price in trading is often used as an overlay to help filter out market noise. Traders use it to spot potential entry and exit points, track momentum, or confirm signals from other indicators. Since it’s less reactive than a raw price chart and more stable than a closing price line, it can help give a clearer picture of overall price direction.
What makes the median price in trading stand out from indicators like moving averages or typical price (which averages high, low, and close) is its focus. It reduces the impact of closing price volatility while still reacting sensitively to price extremes. Compared to moving averages, which lag behind market movements, the median price offers a more immediate, balanced perspective between high and low activity without overfitting the noise.
Formula
The formula for the median price in trading is straightforward:
Median Price = (High + Low) / 2
Interpretation
This indicator plots a single line that represents the midpoint between the high and low of each candle. It helps traders get a quick view of the price equilibrium for a specific period. For instance, if the median price is consistently rising, it might indicate bullish momentum.
A falling median price, on the other hand, may suggest a downtrend. Because it ignores the open and close prices, the median price in trading strips out some of the emotional highs and lows driven by short-term trader behavior, offering a more neutral viewpoint.
Calculation Example
Let’s say a candlestick has a high of $110 and a low of $100:
Median Price = (110 + 100) / 2 = 105
How to Create the Technical Indicator Using LC JS Trader
Step 1: Get LightningChart JS Trader
To begin, you’ll need access to LightningChart JS Trader. This library provides the tools necessary to create advanced technical indicators, including the Median Price Indicator. Visit the LightningChart JS Trader page to download the required components and review the documentation.
Step 2: Review the Interactive Example
LightningChart JS Trader includes interactive examples that demonstrate how to create custom technical indicators. Start by reviewing the documentation, focusing on how to integrate the Median Price Indicator into your chart setup. The interactive examples will guide you through the process of setting up the Median Price Indicator, from importing the necessary modules to modify the chart settings.
Step 3: Code Explanation
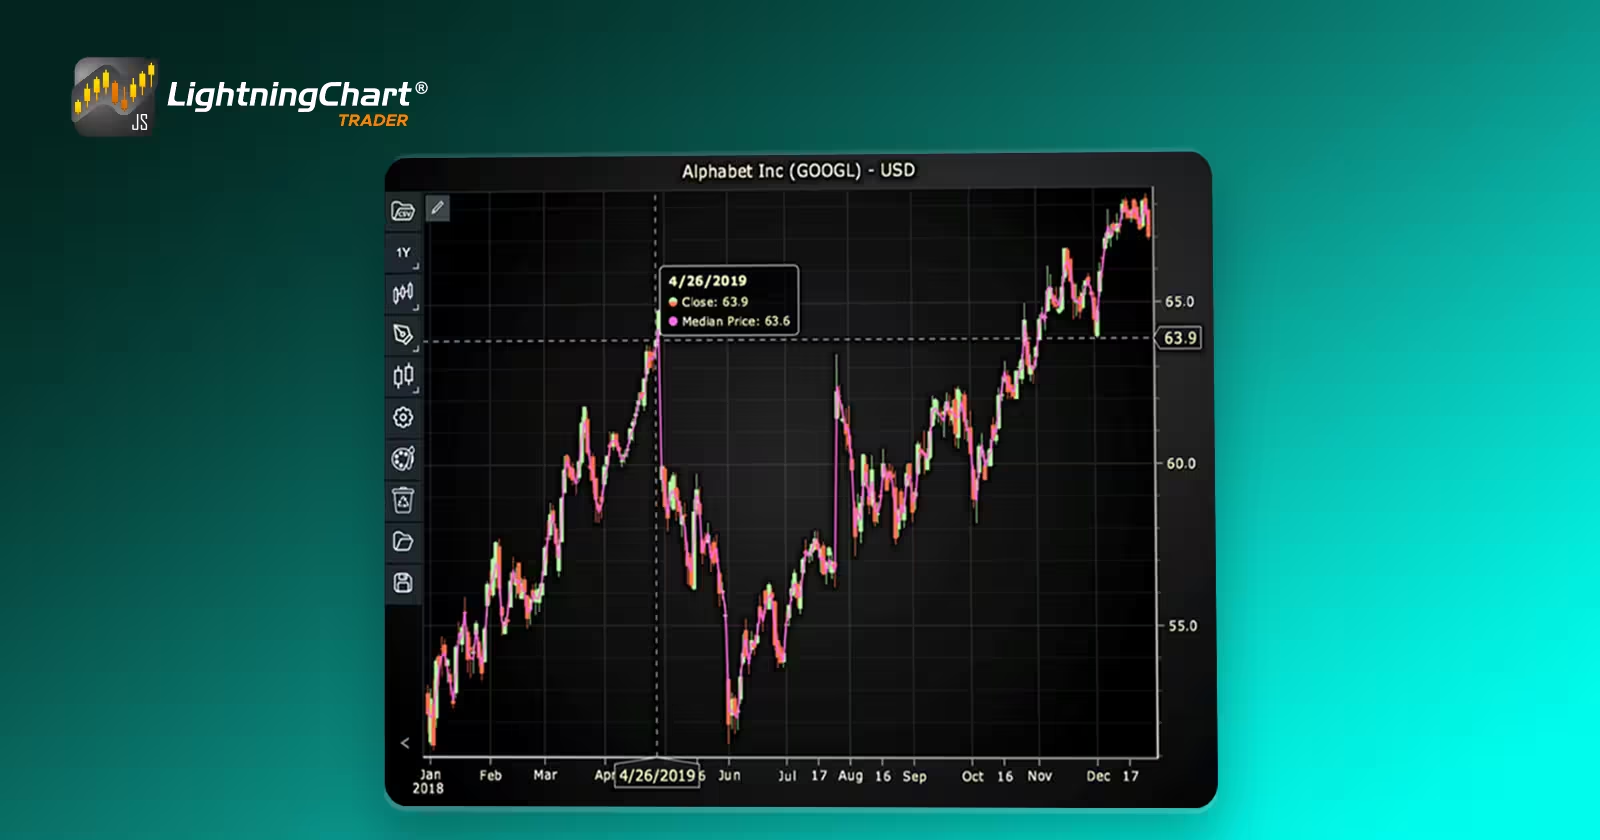
In this step, we will break down the code that creates the chart with the Median Price Indicator, as shown in the image, using LightningChart JS Trader. The code demonstrates how to initialize a trading chart, apply the Median Price Indicator, and customize its appearance.

Here’s a detailed breakdown of each section:
A. Importing the Required Libraries:
   const lcjsTrader = require('@arction/lcjs-trader')
   const lcjs = require('@arction/lcjs')
const { Themes } = lcjs- lcjsTrader: This library provides access to the LightningChart JS Trader functionalities, allowing you to create advanced financial charts.
- lcjs: The main LightningChart JS library, used for general charting functionality.
- Themes: A property within lcjs that provides access to pre-built themes. In this case, we are using the darkGold theme to style the chart.
B. Initializing the Trading Chart:
   lcjsTrader.trader(TRADER_LICENSE).then(async (trader) => {
    // Create a trading chart.
const tradingChart = trader.tradingChart({ loadFromStorage: false, colorTheme: Themes.darkGold })trader(TRADER_LICENSE): Initializes the LightningChart JS Trader with the provided license key (TRADER_LICENSE). This is required to access the charting functionalities for financial data.
Note you can request a LightningChart JS Trader trial license, which is free.
tradingChart(): This function creates a trading chart with certain options.loadFromStorage: false: This disables the loading of previously stored chart data from local storage, ensuring a fresh chart setup.colorTheme: Themes.darkGold: This applies the darkGold theme to the chart, which influences the background color, gridlines, and other visual elements.
C. Adding and Customizing the Indicator
    // Add a Kurtosis Indicator
    const ku = tradingChart.indicators().addKurtosis()
    ku.setPeriodCount(20)
    ku.setMovingAverageType(1)
    ku.setSource(3)
    ku.setLineColor('#E8DB54')
ku.setLineWidth(3)addMedianPrice(): Adds Median Price indicator, which is the average of the High and Low prices for a time period. Median Price is drawn as a single overlay line.
mp.setLineColor('#FF66DE’): Sets the color of the indicator line to pink.
mp.setLineWidth(2): Sets the width of the indicator line to 2 pixels.
D. Loading Data from a CSV File
    // Reading data from a file.
    await fetch(`${document.head.baseURI}examples/assets/0000/Alphabet Inc (GOOGL).csv`).then((res) => res.text()).then((text) => {
        tradingChart.readCsvString(text, 'Alphabet Inc (GOOGL)')
})fetch(): This function retrieves a CSV file containing historical data for Alphabet Inc. (GOOGL). The CSV file includes pricing information for the company’s stock, which is plotted on the chart.readCsvString(): This function reads the CSV data and interprets it as pricing data for Alphabet Inc. The second argument (‘Alphabet Inc (GOOGL)’) sets the label for the chart, as seen at the top of the chart image.
E. Setting the Currency for the Chart
    tradingChart.setCurrency('USD')
})setCurrency('USD'): This sets the currency of the chart to USD, ensuring that the pricing data is interpreted and displayed in US dollars.
Advantages and Limitations of the Indicator
One of the key advantages of the median price in trading is its simplicity. The formula is easy to understand, which makes it accessible to traders at all levels. Because it only relies on the high and low prices, it avoids the potential noise introduced by volatile open or close prices.
This helps smooth out the chart and makes it easier to see underlying trends without getting distracted by short-term fluctuations. When used as an overlay, the median price offers a clear, real-time sense of market direction, especially useful in fast-moving markets. It also complements other indicators well, adding context to tools like RSI, MACD, or Bollinger Bands without overwhelming the chart.
However, the median price in trading is not without its limitations. It only considers two data points, high and low, which means it misses potentially useful information from the open and close. This can lead to a less comprehensive view of market sentiment.
Also, because it is a lagging indicator, it reflects what has already happened rather than predicting future moves. On its own, the median price offers limited decision-making value.
It should ideally be part of a larger technical analysis strategy, used in combination with volume indicators, trendlines, or oscillators to validate signals. Finally, while it reduces noise, it can sometimes oversimplify price action, causing traders to overlook important short-term movements.
Conclusion
The median price in trading is a simple but effective indicator that offers a midpoint perspective of price action. Its value lies in reducing noise and highlighting trends, making it a practical tool in any trader’s kit.
While it’s not as comprehensive as some multi-variable indicators, its clarity and ease of use make it especially useful when combined with an environment like LightningChart JS Trader.
By using LightningChart JS Trader, you can seamlessly integrate the median price into your charting strategy, gaining deeper insights into market behavior and enhancing your technical analysis workflow.
Continue learning with LightningChart

Trend Lines in Trading
Trend lines are among the simplest yet most powerful tools in technical analysis. They help traders visualize market direction, identify potential support and resistance levels, and make more informed trading decisions. Despite their simplicity, trend lines remain a...
Best Python Charting Library in 2026
Python's charting ecosystem is large, overlapping, and regularly misunderstood. Most comparison guides stop at Matplotlib, Plotly, and Seaborn. This one goes further: it covers what happens when your datasets grow large, your update rates increase, or your chart types...
Best TradingView Charting Library Alternative
TradingView's charting libraries are the most visible option for fintech developers. Visibility is not the same as capability. This guide is for developers who have hit the wall on candle count limits, watermark restrictions, branding requirements, real-time...



If you have any questions, feel free to contact us!



©LightningChart Ltd 2026. All rights reserved.





