


LightningChart PythonGold Price Prediction Python Application
TutorialLearn how to develop a gold price prediction Python application using LightningChart Python
Written by a human | Updated on April 23rd, 2025
Gold Price Prediction Python Application
Price predictions and forecasts are crucial elements in the financial market, providing insights and guidance for investors. They help manage risk and inform decision-making by projecting future price movements based on historical data and market indicators. Predicting gold prices, in particular, is of significant interest due to gold’s role as a safe-haven asset and its influence on the global economy.
Factors That Affect the Price of Gold
The price of gold is influenced by various factors, including economic data, geopolitical events, and market sentiment. Key factors include:
- Inflation Rates: Higher inflation often leads to higher gold prices as investors seek to preserve value.
- Currency Strength: A weaker U.S. dollar generally boosts gold prices since gold is priced in USD.
- Geopolitical Stability: Uncertainty or conflict can drive investors to gold.
- Supply and Demand Dynamics: Gold production levels and demand for jewelry and industrial use affect prices.
Central Bank Decisions and Interest Rates
Central banks play a significant role in gold market prediction. Their decisions on interest rates and monetary policy directly impact gold prices. For instance, lower interest rates reduce the opportunity cost of holding gold, often leading to price increases.
Gold Characteristics and Utility
Gold’s unique characteristics, such as its durability, malleability, and conductivity, contribute to its utility in various industries, including electronics and jewelry. These factors, combined with its historical value as a form of currency and store of wealth, make it a critical asset in the global financial system.
LightningChart Python
LightningChart is a high-performance data visualization library that provides a wide range of chart types and features, ideal for visualizing complex data sets like those used in stock market sentiment analysis. Its Python version allows developers to create interactive, high-performance visualizations with ease.

Features and chart types to be used in the Project
LightningChart Python offers a variety of chart types, each designed to handle specific types of data visualization needs. In this project, we use the following chart types to visualize stock price prediction data:
- XY Chart: For visualizing data in two dimensions with series types such as Line Series, Point Line Series, and Area Series.
- Line Series: Ideal for displaying continuous data points connected by straight lines, useful for showing trends over time.
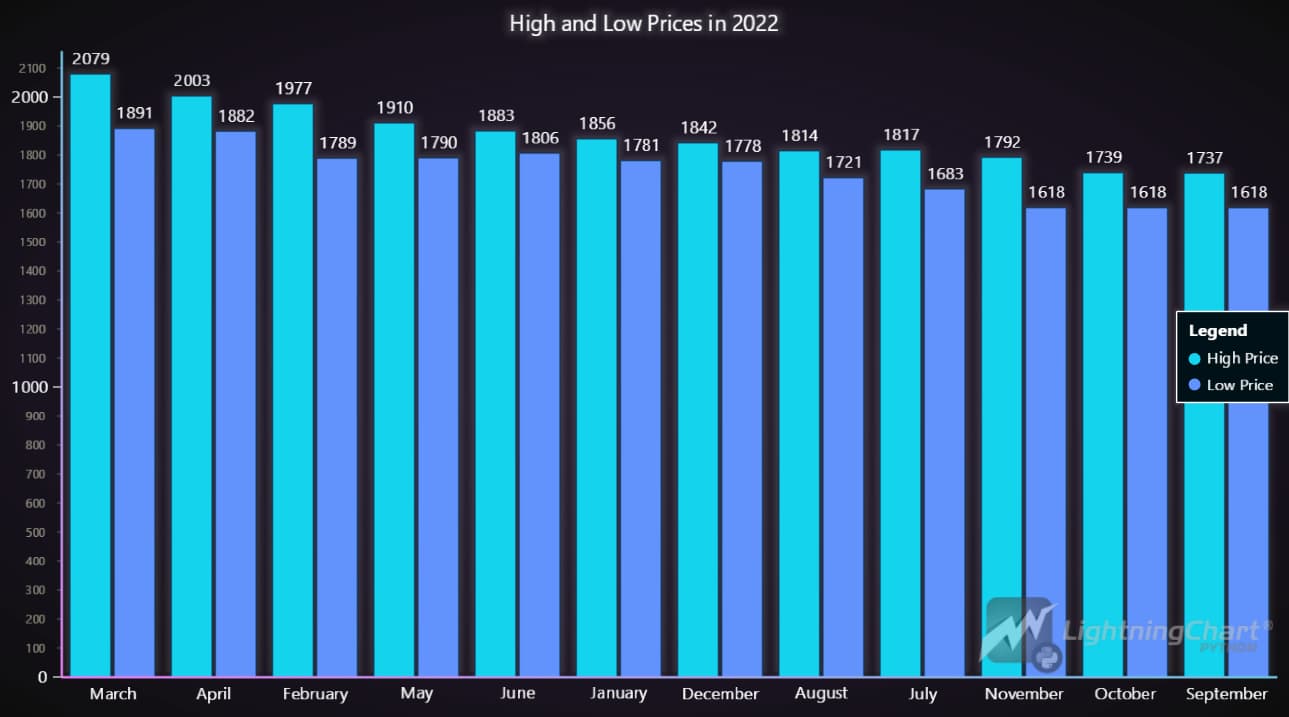
- Bar Chart: Used for visualizing categorical data as bars, making it easy to compare different categories side by side.
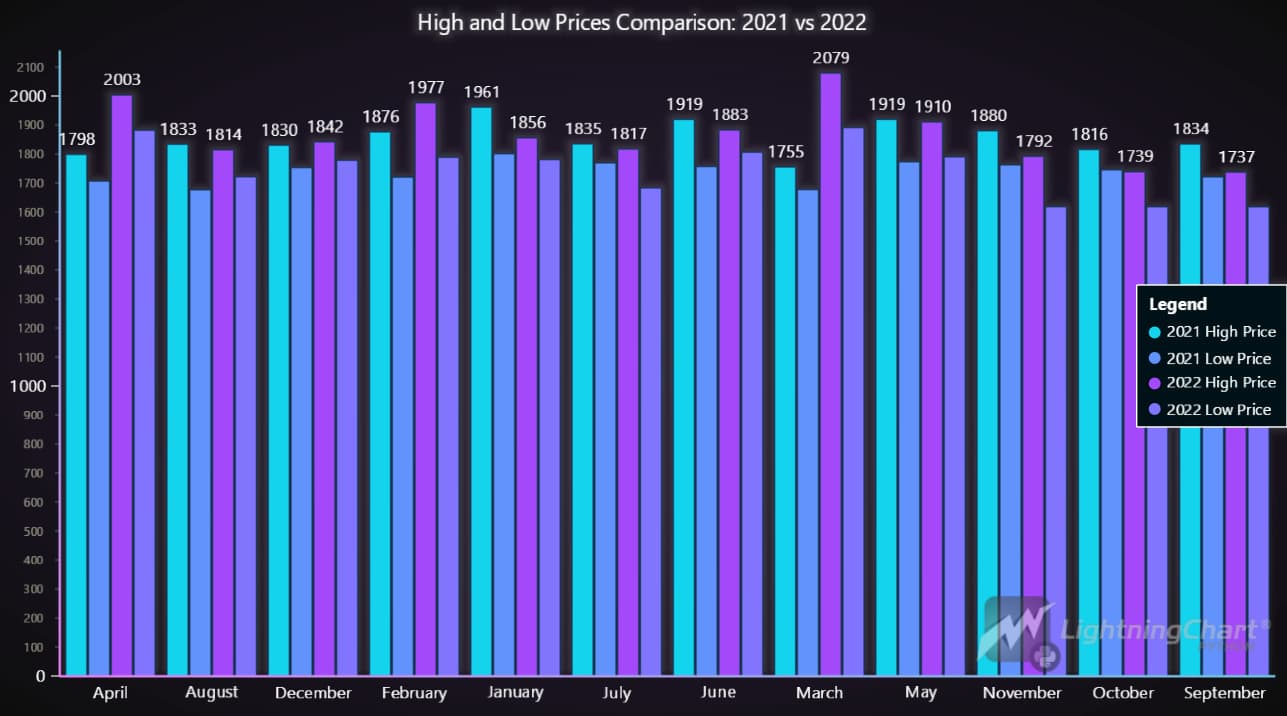
- Grouped Bar Chart: Similar to the bar chart, it groups bars together based on additional categories, facilitating comparison within groups.
- Stacked Bar Chart: Allows for visualizing the composition of each category, showing how individual parts contribute to the whole.
- Area Chart: Fills the area beneath a line series, useful for emphasizing volume or cumulative values.

Performance Characteristics
LightningChart handles millions of data points with ease and maintains smooth user interactions. One of the standout aspects of LightningChart Python is its performance. The library is optimized for handling large volumes of data with minimal latency, which is crucial for financial applications where data needs to be processed and visualized in real time to inform trading decisions.
Setting Up Python Environment
Installing Python and Necessary Libraries
To begin with the development of the gold price prediction Python application, you need to set up your development environment. Start by installing Python from the official Python website. LightningChart Python requires Python version 3.10 or higher. To get the documentation and the license, please visit LightningChart Python Website. Also, you can visit the GitHub gold price prediction to get the original source code.
pip install lightningcharts random numpy pandas scikit-learn tensorflowimport lightningchart as lc
import random
lc.set_license('my-license-key')
import numpy as np
import pandas as pd
import time
from sklearn.preprocessing import MinMaxScaler
from sklearn.model_selection import train_test_split
from sklearn.metrics import mean_absolute_percentage_error
import tensorflow as tf
from keras import Model
from keras.layers import Input, Dense, Dropout
from keras.layers import LSTMOverview of Libraries Used
- LightningChart: Advanced data visualization.
- NumPy: Numerical computation.
- Pandas: Data manipulation and analysis.
- Scikit-learn: Data mining and data analysis.
- Tensorflow: Machine learning model development.
Setting Up Your Development Environment
Recommended IDEs include Jupyter Notebook, PyCharm, or Visual Studio Code.
Loading and Processing Data
Data can be loaded from CSV or other file formats using Pandas:
import pandas as pd

# Load the CSV file
df = pd.read_csv('./gold_data.csv')
Handling and preprocessing the data
Preprocessing steps may include handling missing values, normalizing data, and feature engineering.
# Dropping 'Vol.' and 'Change %'
df.drop(['Vol.', 'Change %'], axis=1, inplace=True)

# Transforming the data in the data frame
df['Date'] = pd.to_datetime(df['Date'])
df.sort_values(by='Date', ascending=True, inplace=True)
df.reset_index(drop=True, inplace=True)

# Removing the “,” sign
NumCols = df.columns.drop(['Date'])
df[NumCols] = df[NumCols].replace({',': ''}, regex=True)
df[NumCols] = df[NumCols].astype('float64')

# Checking Duplicates and Missing Values
df.duplicated().sum()
df.isnull().sum().sum()
Validation of the Study
By employing an LSTM (Long Short-Term Memory) model, we successfully forecasted the adjusted closing price of gold ETFs. The predictive model’s performance was validated using the MAPE (Mean Absolute Percentage Error) metric, yielding the following results:
- Test Loss: 0.0011
- Test MAPE: 0.0379
- Test Accuracy: 0.96
These findings indicate that the LSTM model is highly effective, achieving a low test loss and a MAPE of approximately 3.79%. The model’s test accuracy of 96.21% highlights its robustness and reliability in predicting gold prices. Utilizing LightningChart for data visualization further enhanced our analysis, providing clear and interactive visual representations of the forecasted data.
Visualizing Data with LightningChart
LightningChart Python allows for the creation of highly interactive and customizable charts. Here are some of the LC charts below:


Creating the charts
To visualize the data, you can create various charts using LightningChart Python:
import lightningchart as lc
import random

# Initialize LightningChart and set the license key
lc.set_license('my-license-key')

# Creating a chart using LightningChart
chart = lc.ChartXY(title= 'Gold Price History Data')
Customizing visualizations
LightningChart offers extensive customization options. You can change the theme and colors, add markers, hide or sort some features or integrate real-time data updates to enhance the visualization:
# Initialize the chart
chart = lc.ChartXY(
theme=lc.Themes.CyberSpace,
title='Gold Price History Data'
)

# Adding and configuring the x-axis for datetime display
x_axis = chart.get_default_x_axis()
x_axis.set_tick_strategy('DateTime', time_origin=time_origin)

# Adding a line series
series = chart.add_line_series()
series.add(x=x_values, y=y_values)

# Customizing axes titles
x_axis.set_title('Date')
chart.get_default_y_axis().set_title('Scaled Price')

# Opening the chart
chart.open()
Conclusion
Through this project, we demonstrated how to predict gold prices using Python and visualize the data with LightningChart. Using an LSTM model, we accurately predicted the adjusted closing price of gold ETFs. The test accuracy of 96% confirms the model’s robustness. LightningChart provided effective visualization, enhancing our analysis with clear, interactive charts.
Benefits of using LightningChart Python for developing a portfolio optimization Python application?
LightningChart Python offers robust performance, making it ideal for financial data analysis. Its extensive customization options and high rendering efficiency enable detailed and interactive visualizations, enhancing the overall analysis process.

Ahmad Omid
Data Science Python Developer
Continue learning with LightningChart

Streaming Data Visualization with WebSockets (2026): The Complete Tutorial
Every WebSocket tutorial on the internet shows the same thing: a server sends a random number every second, a chart updates. It works. The demo looks great. Then you deploy to production, your IoT sensors push 800 updates per second across twelve channels, and the...

Best ScottPlot Alternative in 2026: GPU Rendering, 3D Charts, Cross-Language Support
ScottPlot is genuinely excellent for what it is: a free, MIT-licensed, actively developed .NET plotting library with an honest focus on interactive large-dataset display. The GDI+ rasterized renderer — which draws the entire chart as a pixel bitmap rather than...
Using Fibonacci Tools in Trading: A Practical Guide for Market Analysis
Using Fibonacci Tools in Trading: A Practical Guide for Market AnalysisTechnical traders rely on various tools to identify potential support, resistance, and price targets. Among the most widely used are Fibonacci tools, which are based on the mathematical sequence...


If you have any questions, feel free to contact us!
©LightningChart Ltd 2026. All rights reserved.