


Blog
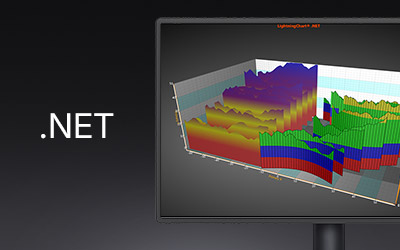
3D Waterfall Chart
Leverage LightningChart and WPF to create a 3D waterfall chart data visualization application for advanced analytics.
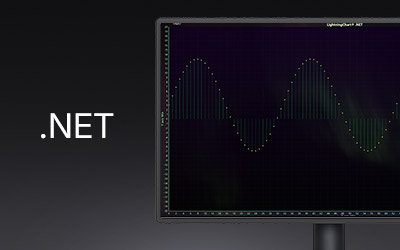
Stem Plot
Learn how to create your own stem plot charting application in WPF using the LightningChart .NET library.
WPF Themes
Discover 11 WPF themes in LightningChart .NET designed to enhance your charting app’s UI and deliver a visually stunning user experience.

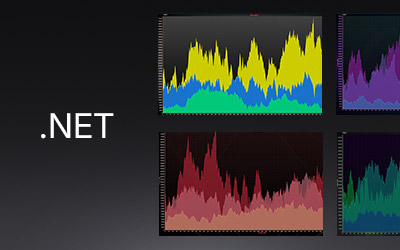
Spline Chart Example
Learn how to create a spline chart example to build a high-performance charting application using LightningChart JS library.

3D Scatter Chart
Create a 3D scatter chart application in JavaScript with LightningChart and visualize 3D data in your next app development project.
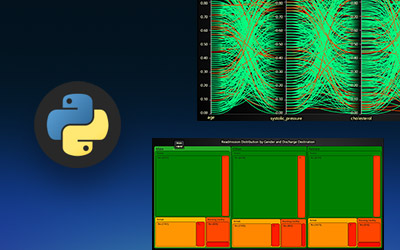
Hospital Readmission Prediction
Explore how LightningChart Python enhances data visualization in hospital readmission prediction analysis for better healthcare outcomes.
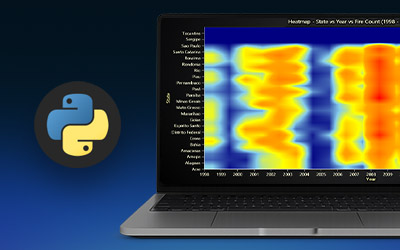
Forest Fire Analysis
Explore the steps to develop a robust forest fire analysis using LightningChart Python, and improve your data visualization techniques.
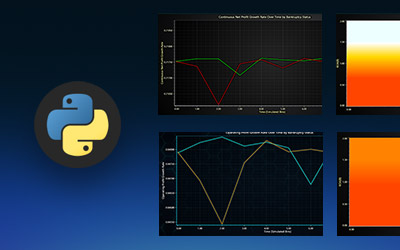
Bankruptcy Prediction Analysis
Explore how to leverage LightningChart in Python for effective bankruptcy prediction and improve your financial analysis skills.
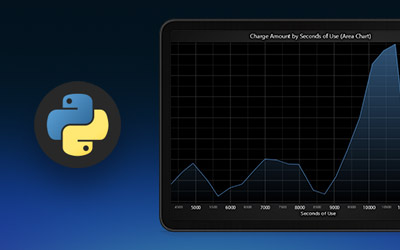
Telecom Churn Analytics
Explore effective strategies for visualizing telecom churn analytics using LightningChart Python to improve customer retention and insights.
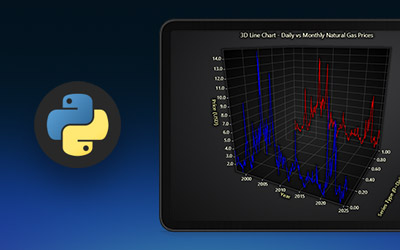
Global Natural Gas Prices
Discover effective techniques for visualizing data trends and patterns in global natural gas prices with LightningChart Python.


If you have any questions, feel free to contact us!
©LightningChart Ltd 2026. All rights reserved.