


Blog
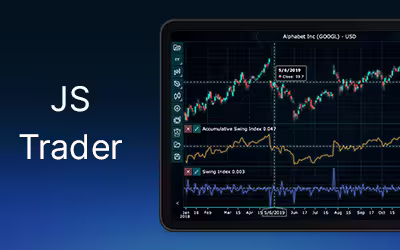
Accumulative Swing Index for Fintech Applications
Learn how the Accumulative Swing Index Indicator tracks long-term market trends, measures momentum, and simplifies technical analysis in Fintech Applications.
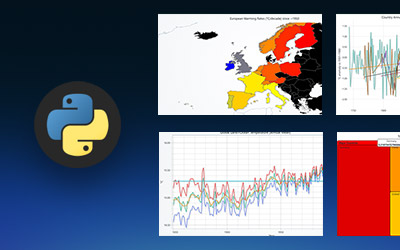
Global Temperature Trends
Discover the insights behind global temperature trends through effective visualizations using LightningChart Python for climate data analysis.
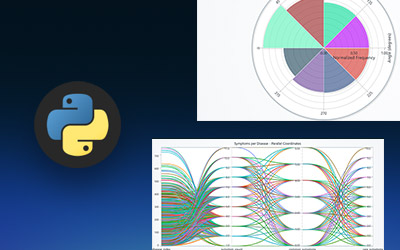
Disease Symptom Data Visualization
Explore effective techniques for displaying complex health trends through disease symptom data visualization using LightningChart Python.
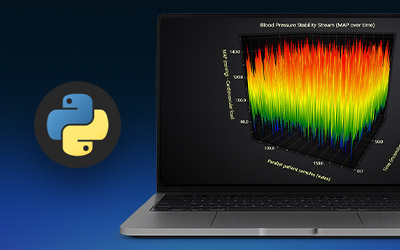
Healthcare Patient Data
Discover how to build a Python app for monitoring and managing healthcare patient data with LightningChart, ensuring better healthcare services.
Weighted Close Indicator in Technical Analysis
Learn how the Weighted Close Indicator emphasizes the closing price to smooth trends, gauge momentum, and enhance technical analysis strategies.
Cryptocurrency and Stock Market Analysis
Learn how to conduct a cryptocurrency and stock market analysis using LightningChart Python data visualization library.
Healthcare Data Visualization
Learn to conduct a comprehensive healthcare data visualization analysis using LightningChart Python.

Redefining Python Data Viz: The Evolution of LightningChart Performance
Discover why LightningChart Python is the fastest data visualization library in 2026. Render 100M+ points in real-time with GPU-accelerated performance.

Water Potability Analysis
Learn to utilize LightningChart in Python for effective water potability analysis, ensuring safe and reliable drinking water evaluations.
Crop Yield Data Visualization
Discover techniques for crop yield data visualization in Python with LightningChart, enhancing your agricultural data analysis skills.


If you have any questions, feel free to contact us!
©LightningChart Ltd 2026. All rights reserved.