


Blog
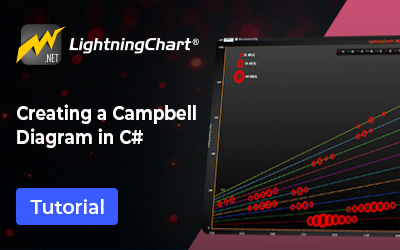
Campbell Diagram
A Campbell diagram is a graph used in modeling turbulence and rotational dynamics. Learn how to create a Campbell Diagram in C#.
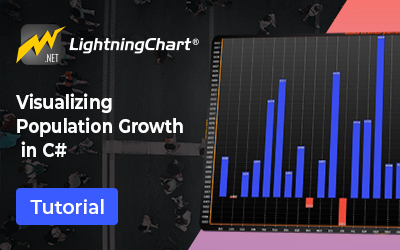
Visualizing population growth data
Building a WPF charting application for visualizing population growth data with LightningChart .NET (free ZIP project).
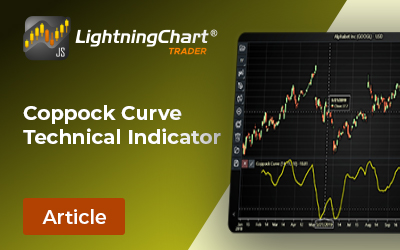
Coppock Curve Indicator
Coppock Curve technical indicator is used by traders to identify long-term buy and sell signals revealing opportune moments to enter the market.
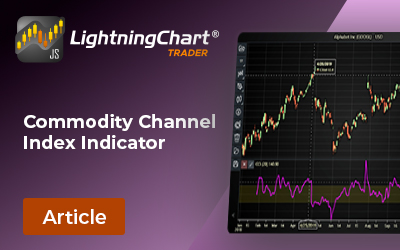
Commodity Channel Index Indicator
Commodity Channel Index indicator is a momentum oscillator that measures deviation of an asset’s price from its average price over a period.
Chande Momentum Oscillator
Chande Momentum Oscillator captures both upward and downward price movements, providing a balanced measure of market momentum.

Chande Forecast Oscillator
Chande Forecast Oscillator shows momentum & price direction by comparing asset’s closing & forecasted prices using an n-period linear regression
Center of Gravity Indicator
The Center of Gravity Indicator (COG) is a predictive, lag-free oscillator designed to help traders anticipate price reversals.

Balance Of Power Indicator
Balance of Power indicator is a technical tool widely used by traders to measure the strength of buying and selling pressures within the market.
Awesome Oscillator
What is Awesome Oscillator? Awesome Oscillator is used by traders to assess market momentum and identify potential reversals in price trends.
Aroon Price Oscillator
The Aroon Price Oscillator is a powerful technical analysis tool that offers insight into the strength of an uptrend or downtrend in the market.


If you have any questions, feel free to contact us!
©LightningChart Ltd 2026. All rights reserved.