


Blog
NASDAQ Stock Market
Learn how to create a NASDAQ stock market data analysis examining close and open prices, their correlation, and ranges using LightningChart.

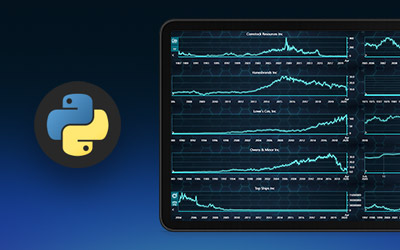
Stock Market Data Visualization
Stock market data visualization Python analysis using LightningChart. Learn technical analysis, advanced charting, and trading strategies.

Air-Gapped Environment
Secure high-performance data visualization for air-gapped environments with LightningChart JS. Essential for critical, isolated networks.
Creating a Real-Time JavaScript Dashboard with ChatGPT Prompts
Creating a dashboard with ChatGPT prompts is easy and convenient to get started with your data application project easily with LightningChart JS.

Industrial Pipeline Visualization
Simulating an industrial pipeline visualization from its interior view for obstruction detection, corrosion inspection or leak prevention.

XY Chart Types
Get to know some of the most powerful JavaScript XY chart types and how to create them using the LightningChart JS library.

Best OxyPlot Alternative
Explore the best OxyPlot alternative when creating data visualization applications with WPF charting libraries.

Gold Price Prediction Application
Learn to build a Python application that forecasts gold prices effectively using a gold price prediction application & LightningChart Python.

Industrial Alarm Monitoring App
In the industrial sector, effective alarm monitoring is essential. This post explores creating a Python application for industrial alarm monitoring.

Dashed Line Chart
Learn how to create a dynamic app using LightningChart JS that displays data visually through a stunning dashed line chart.


If you have any questions, feel free to contact us!
©LightningChart Ltd 2026. All rights reserved.