


Lighting

Introduction
Light Sources
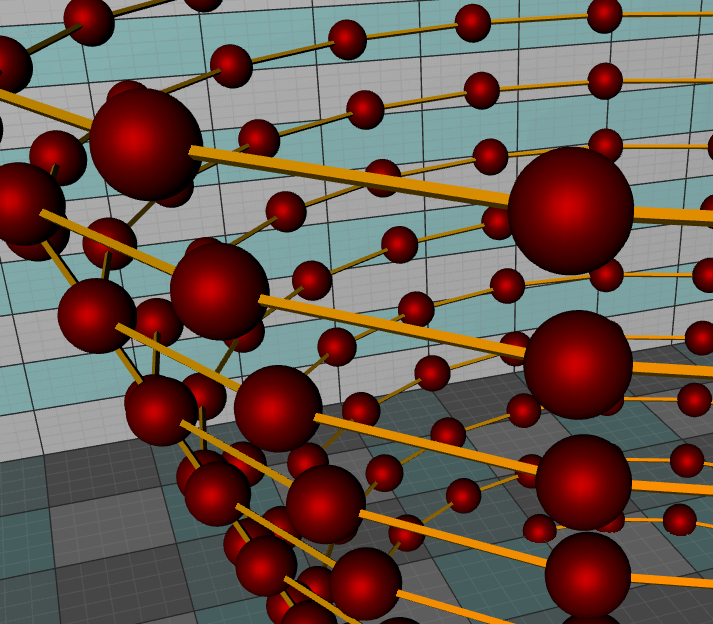
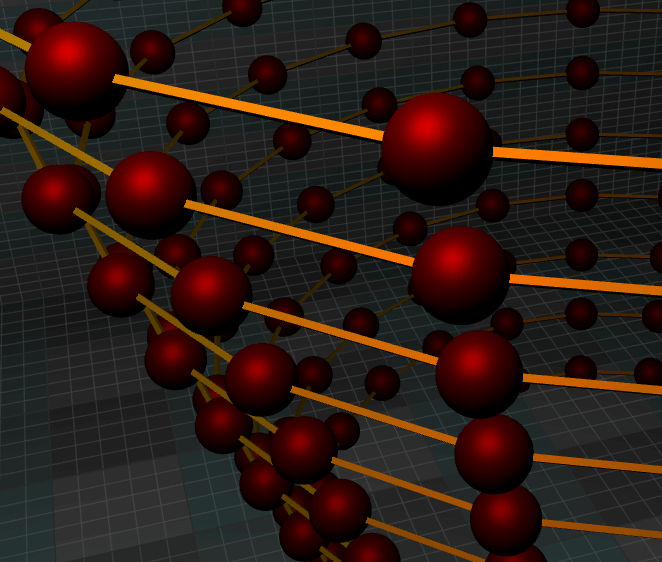
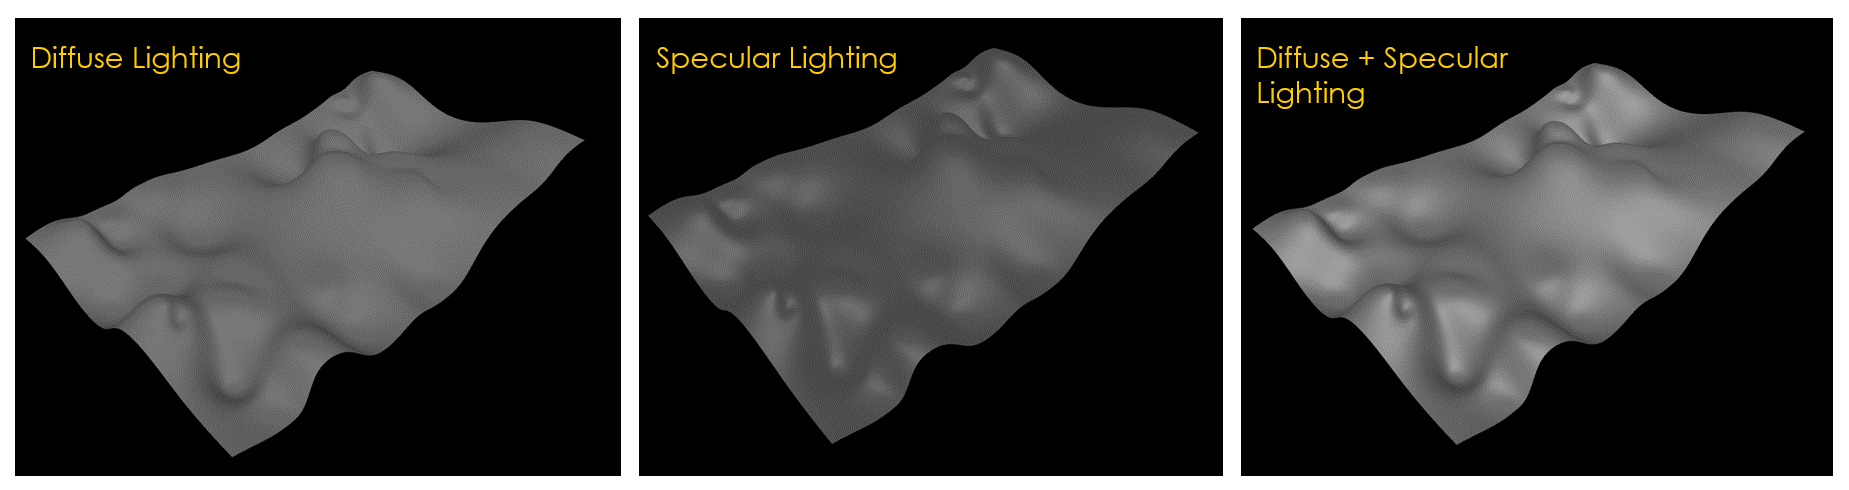
Light and surface interactions
Computation on GPU
Conclusion
Create a vibration charts application with 2D & 3D spectrograms
Written by a human | Updated on April 10th, 2025JS Spectrogram ApplicationHello, in this article we will create a JS dashboard with 2D and 3D spectrogram charts. The purpose of creating this project is to explain how to create a vibration analysis application that...
Ionic app development
Written by a human | Updated on April 10th, 2025Beginning Ionic App Development with Capacitor, Angular & LightningChart JS [This is the second part of the article "Data Visualization with Ionic Capacitor, Angular & JS Charts (Part 1)"] In the previous...
Ionic Capacitor
Learn how to use Ionic Capacitor for data visualization and build a mobile charting application with Angular & LightningChart JS


If you have any questions, feel free to contact us!
©LightningChart Ltd 2026. All rights reserved.