LightningChart JSCreate an interactive React bar chart
TutorialGet started with React JS creating a high-performance bar chart with LightningChart JS
React Bar Chart
Hello!
If you have seen the previous articles, we have practiced with various JavaScript-based frameworks. We have implemented the Lightning Charts library and taken advantage of its great compatibility with each of the frameworks seen. In this article we will practice with React JS, during this period, we will do several exercises using React.
What is React JS?
Mainly, React JS is a framework created by Facebook used to build user interfaces but there are charting libraries compatible with React JS that help developers to use familiar tools and easily create custom charts within their applications.
In this tutorial, we’ll be using LightningChart JS and its bar chart component for building a high-performance React bar chart application. We’ll also do an initial setup of our React bar chart project and a brief implementation of LightningChart JS to showcase the use of the library.
Project Overview
Bar charts are easy to understand and widely used. Bar charts display categorical data with rectangular (horizontal or vertical) bars where their height or length is proportional to the value represented.
Simple bar charts can be created using a variety of tools but this particular tutorial is oriented toward developers who want to code their applications using React JS and add simple yet powerful bar chart visualizations.
Download the project to follow the tutorial
Installing React JS
In order to install React JS using commands, you will need to have Node JS and the NPM command interface installed. In previous Node JS articles, we have explained how to install it or you can also visit the NPM documentation page.
Already having NPM installed, we can execute the React JS installation command. First, we need to open a command prompt as administrator and run the following command:
In order to install React JS using commands, you will need to have Node JS and the NPM command interface installed.
In previous Node JS articles, we have explained how to install it or you can also visit the NPM documentation page.
Already having NPM installed, we can execute the React JS installation command.
First, we need to open a command prompt as administrator and run the following command:
npm i -g create-react-appThe above command will download the complete react library. Once React is installed, we will see a list of React commands which serves as a confirmation of a successful installation.
The above command will download the complete react library.
Once React is installed, we will see a list of React commands which serves as a confirmation of a successful installation.

Now we will create a react project. We will execute the following command from the command prompt:
npx create-react-app lc-react-app“lc-react-app” will be the name of our React bar chart project, you can change the name to your needs.

When the project has been created, the path where the project has been stored will be displayed. I recommend cutting and pasting the project into an easily accessible path.
When the project has been created, the path where the project has been stored will be displayed.
I recommend cutting and pasting the project into an easily accessible path.

React Bar Chart Project Configuration
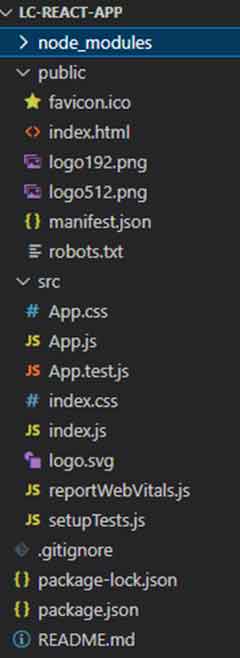
Before we begin, we’ll need to install the Lightning Charts JS library. Open your React bar chart project with Visual Studio Code:

Your project should look the same or similar to the image above. Now open a new terminal so you can install LightningChart JS.
npm i @arction/lcjsThe npm i @arction/lcjs command will install the Lightning Charts JS library into our project. If we execute the command npm start, we will be able to compile and view our page on a local server:
The npm i @arction/lcjs command will install the Lightning Charts JS library into our project.
If we execute the command npm start, we will be able to compile and view our page on a local server:

Bar Chart
Before we start with the code for our chart, we have to understand the files on which we will work.

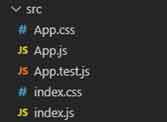
Unlike Angular projects where our views and logic are grouped by component, React starts are grouped with a simpler structure. The first thing we will see are the two JS files, index.js, and App.js.
These files have a default naming but can be renamed according to your needs. The index file will contain code that allows us to render the view created by the App.js file. App.js contains our logic in charge of building the object to render.
The CSS files will modify the style of the objects generated in their corresponding JS files. When we create a React project, an App.test.js file is generated.
This file corresponds to our App.js file and can be used to test our code using the “npm test” command. The basic idea is that there is a .test file for each generated JS file.
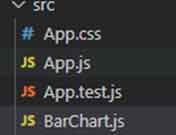
For this project, we will create a new file called BarChart.js. This file will contain the code that will generate our bar chart. We do it separately to keep our chart code organized, instead of embedding everything in App.js
Unlike Angular projects where our views and logic are grouped by component, React starts are grouped with a simpler structure.
The first thing we will see are the two JS files, index.js, and App.js.
These files have a default naming but can be renamed according to your needs.
The index file will contain code that allows us to render the view created by the App.js file.
App.js contains our logic in charge of building the object to render.
The CSS files will modify the style of the objects generated in their corresponding JS files.
When we create a React project, an App.test.js file is generated.
This file corresponds to our App.js file and can be used to test our code using the “npm test” command.
The basic idea is that there is a .test file for each generated JS file.
For this project, we will create a new file called BarChart.js.
This file will contain the code that will generate our bar chart.
We do it separately to keep our chart code organized, instead of embedding everything in App.js

1. Importing components
To get started, we’ll begin by importing the necessary Lightning Charts classes. The way to import components is the same used as in an Angular project.
1. Importing components
We’ll start by importing the necessary Lightning Charts classes.
The way to import components is the same used as in an Angular project.
import { lightningChart,emptyLine,AutoCursorModes,UIOrigins,LegendBoxBuilders,AxisScrollStrategies,AxisTickStrategies,UIElementBuilders, Themes } from '@arction/lcjs'
import React, { useRef, useEffect } from 'react'
2. Create the React Bar Chart object
Now we have to create the object that contains our chart and can be exported to other instances.
const Chart = (props) => {
    const { data, id } = props
    const chartRef = useRef(undefined)

    useEffect(() => {
Using the Effect Hook allows you to run side effects like fetching, direct DOM updating, and timers. Inside the useEffect function, we’ll encapsulate all of our React bar chart graph logic.
Using the Effect Hook allows you to run side effects like fetching, direct DOM updating, and timers.
Inside the useEffect function, we’ll encapsulate all of our bar graph logic.
3. Bar chart interface
Now we have to construct an interface for the React bar chart. This interface will contain all the properties for this chart. In the following code, you’ll see how we are specifying the sizes for all the vertical bars.
3. Bar chart interface
Now we have to construct an interface for the bar chart. This interface will contain all the properties for this chart.
In the following code, you’ll see how we are specifying the sizes for all the vertical bars.
let barChart
        {
            barChart = (options) => {
                const figureThickness = 10
                const figureGap = figureThickness * .25
                const groupGap = figureGap * 3.0
                const groups = []
								const categories = []
4. Global Properties
For this React bar chart, is necessary to specify properties for the axes and chart object. In the chart object, we will specify global properties, like the title, page padding, and mouse behaviors.
To create an object that refers to a specific axis, we will use the function [getDefaultAxisX -Y] and add some properties as well.
const chart = lc.ChartXY(options)
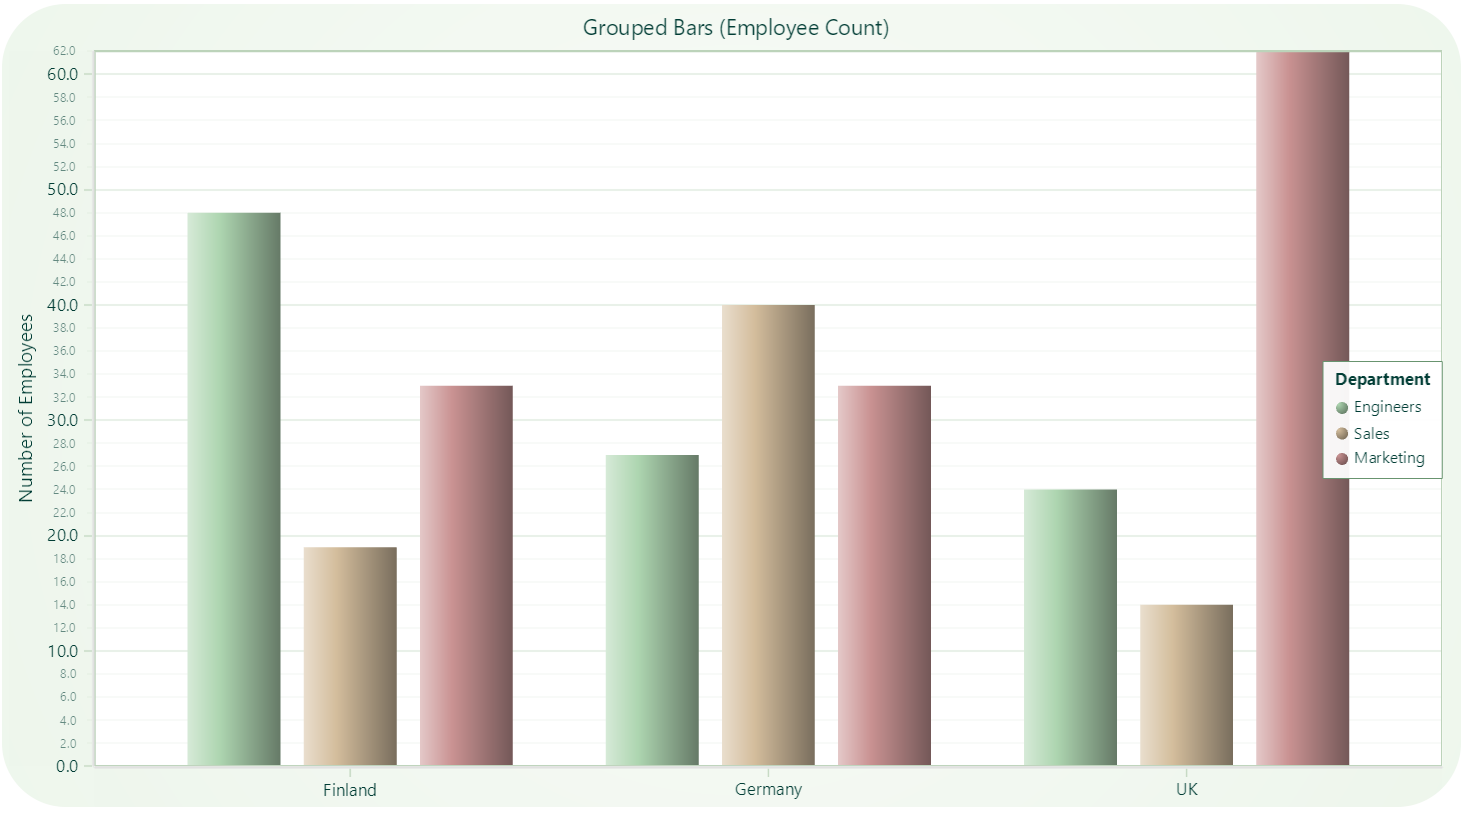
                    .setTitle('Grouped Bars (Employee Count)')
                    .setAutoCursorMode(AutoCursorModes.onHover)
                    // Disable mouse interactions (e.g. zooming and panning) of plotting area
                    .setMouseInteractions(false)
                    // Temporary fix for library-side bug. Remove after fixed.
                    .setPadding({ bottom: 30 })

                // X-axis of the series
                const axisX = chart.getDefaultAxisX()
                    .setMouseInteractions(false)
                    .setScrollStrategy(undefined)
                    // Disable default ticks.
                    .setTickStrategy(AxisTickStrategies.Empty)

                // Y-axis of the series
                const axisY = chart.getDefaultAxisY()
                    .setMouseInteractions(false)
                    .setTitle('Number of Employees')
                    .setInterval(0, 70)
                    .setScrollStrategy(AxisScrollStrategies.fitting)
5. [setAutoCursor]
The [setAutoCursor] function will let us modify the visual properties of the cursor over the react bar chart.
chart.setAutoCursor(cursor => cursor
                    .disposePointMarker()
                    .disposeTickMarkerX()
                    .disposeTickMarkerY()
                    .setGridStrokeXStyle(emptyLine)
                    .setGridStrokeYStyle(emptyLine)
                    .setResultTable((table) => {
                        table
                            .setOrigin(UIOrigins.CenterBottom)
                    })
                )
The emptyLine property will hide the line indicators:

6. createSeriesForCategory
The following function creates a Rectangle series for each category, which adds the cursor functionality to them.
const createSeriesForCategory = (category) => {
                    const series = chart.addRectangleSeries()
                    // Change how marker displays its information.
                    series.setCursorResultTableFormatter((builder, series, figure) => {
                        // Find cached entry for the figure.
                        let entry = {
                            name: category.name,
                            value: category.data[category.figures.indexOf(figure)]
                        }
                        // Parse result table content from values of 'entry'.
                        return builder
                            .addRow('Department:', entry.name)
                            .addRow('# of employees:', String(entry.value))
                    })
                    return series
                }
7. LegendBox
In the previous function, we add the name of the department and the number of employees. Those values will be added as row data inside the vertical line. In the following property, we can specify the behavior of those values as a “legend box”.
7. LegendBox
In the previous function, we add the name of the department and the number of employees.
Those values will be added as row data inside the vertical line. In the following property, we can specify the behavior of those values as a “legend box”.
const legendBox = chart.addLegendBox(LegendBoxBuilders.VerticalLegendBox)
                    // Dispose example UI elements automatically if they take too much space. This is to avoid bad UI on mobile / etc. devices.
                    .setAutoDispose({
                        type: 'max-width',
                        maxWidth: 0.20,
                    })
                    .setTitle('Department')
8. redraw function
The following function redraws bars chart based on values of groups and categories:
const redraw = () => {
                    let x = 0
                    for (let groupIndex = 0; groupIndex < groups.length; groupIndex++) {
                        const group = groups[groupIndex]
                        const xStart = x
                        for (const category of categories) {
                            const value = category.data[groupIndex]
                            if (value !== undefined) {
                                // Position figure of respective value.
                                const figure = category.figures[groupIndex]
                                figure.setDimensions({
                                    x,
                                    y: 0,
                                    width: figureThickness,
                                    height: value
                                })
                                // Figure gap
                                x += figureThickness + figureGap
                            }
                        }
                        // Position CustomTick
                        group.tick.setValue((xStart + x - figureGap) / 2)

                        // Group gap
                        x += groupGap
                    }
                    axisX.setInterval(-(groupGap + figureGap), x)
                }
9. addGroups & categories
Now we have to add groups and categories. For each type, we will draw a bar using the redraw function. Finally, the barChart object will provide categories and groups.
9. addGroups & categories
Now we have to add groups and categories. For each type, we will draw a bar using the redraw function.
Finally, the barChart object will provide categories and groups.
const addGroups = (names) => {
                    for (const name of names)
                        groups.push({
                            name,
                            tick: axisX.addCustomTick(UIElementBuilders.AxisTick)
                                .setGridStrokeLength(0)
                                .setTextFormatter((_) => name)
                        })
                }
                const addCategory = (entry) => {
                    // Each category has its own series.
                    const series = createSeriesForCategory(entry)
                        .setName(entry.name)
                    entry.figures = entry.data.map((value) => series.add({ x: 0, y: 0, width: 0, height: 0 }))
                    legendBox.add(series)
                    categories.push(entry)
                    redraw()
                }
                // Return public methods of a bar chart interface.
                return {
                    addCategory,
                    addGroups
                }
10. Themes and UI
To finish, we can specify the theme (UI) to our React bar chart and add the categories and data to this object.
const chart = barChart({
            container: id,
            theme: Themes.cyberSpace,
        })

        // Add groups
        chart.addGroups(['Finland', 'Germany', 'UK'])

        // Add categories of bars
        const categories = ['Engineers', 'Sales', 'Marketing']
        const data = [
            [48, 27, 24],
            [19, 40, 14],
            [33, 33, 62]
        ]
        data.forEach((data, i) =>
            chart.addCategory({
                name: categories[i],
                data
            })
        )
11. Return function
The return function will destroy the graphic when the component is unmounted. The chart will be stored inside a container (id). The class name “chart” will be used to apply the CSS class located in the App.css file.
11. Return function
The return function will destroy the graphic when the component is unmounted.
The chart will be stored inside a container (id). The class name “chart” will be used to apply the CSS class located in the App.css file.
return () => {
        console.log('destroy chart')
        chartRef.current = undefined
        }
    }, [id])

    return <div id={id} className='chart'></div>
}

export default Chart
12. Rendering the React bar chart
To render our React bar chart object, we need to import it into our App.js file. The App constant will return the Chart object.
Also, we can apply a CSS Class for the body. The CSS class is located in the App.css file.
12. Rendering the React bar chart
To render our React bar chart object, we need to import it into our App.js file.
The App constant will return the Chart object. Also, we can apply a CSS Class for the body. The CSS class is located in the App.css file.
import React, { useEffect, useState } from 'react';
import './App.css'
import Chart from './BarChart'

const App = (props) => {
  return <div className='fill'>
    <Chart id='chart'/>
  </div>
}

export default App
13. App constant
The App constant will be exported to the index.js file.
import React from 'react';
import ReactDOM from 'react-dom/client';
import './index.css';
import App from './App';
import reportWebVitals from './reportWebVitals';

const root = ReactDOM.createRoot(document.getElementById('root'));
root.render(
  <React.StrictMode>
    <App />
  </React.StrictMode>
);
The last step is to import our App.js into index.js. The way to import/export objects between JS files is similar in almost all cases. For Index files, we need to apply some react properties because here is where we will manipulate the DOM.
React Strict Mode: Strict mode checks are run in development mode only. They do not impact the production build.
The last step is to import our App.js into index.js. The way to import/export objects between JS files is similar in almost all cases.
For Index files, we need to apply some react properties because here is where we will manipulate the DOM.
React Strict Mode: Strict mode checks are run in development mode only. They do not impact the production build.
Final Application
When combined with React, developers can take advantage of LightningChart JS’s flexibility and modularity, enabling the creation of highly responsive and dynamic charts that can be easily integrated into their applications
Overall, using LightningChart JS to build a React bar chart provides an excellent solution for data visualization needs, offering high performance, flexibility, and customization options.
Whether you’re building a business dashboard or a data analytics platform, LightningChart JS can help you create stunning visualizations that effectively communicate your data insights to your audience.
To see more of the charts you can create with LightningChart JS, check our Interactive Examples.


