


Lighting

Introduction
Light Sources
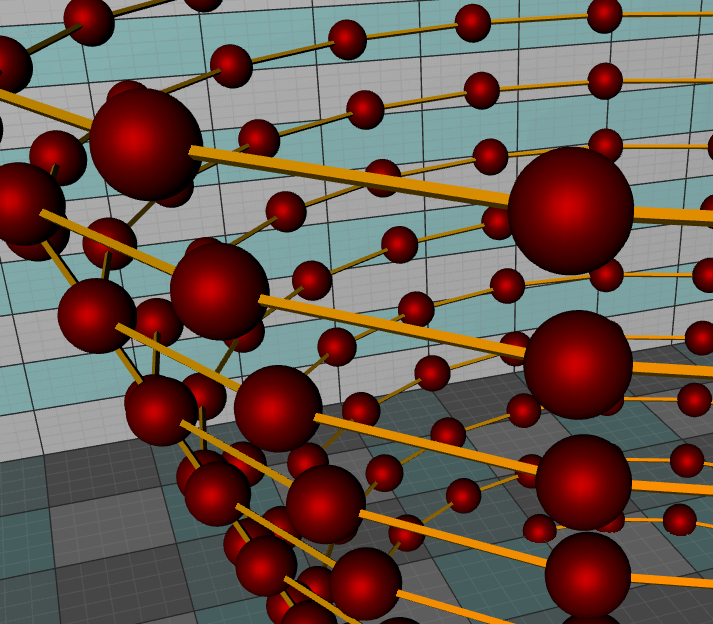
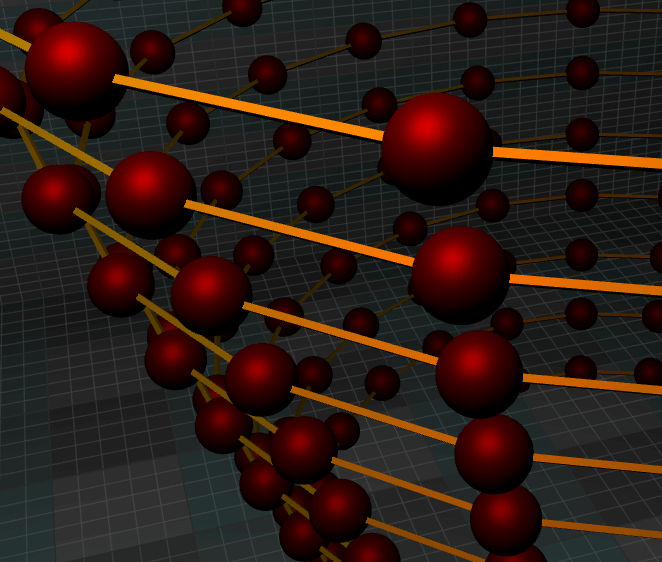
Light and surface interactions
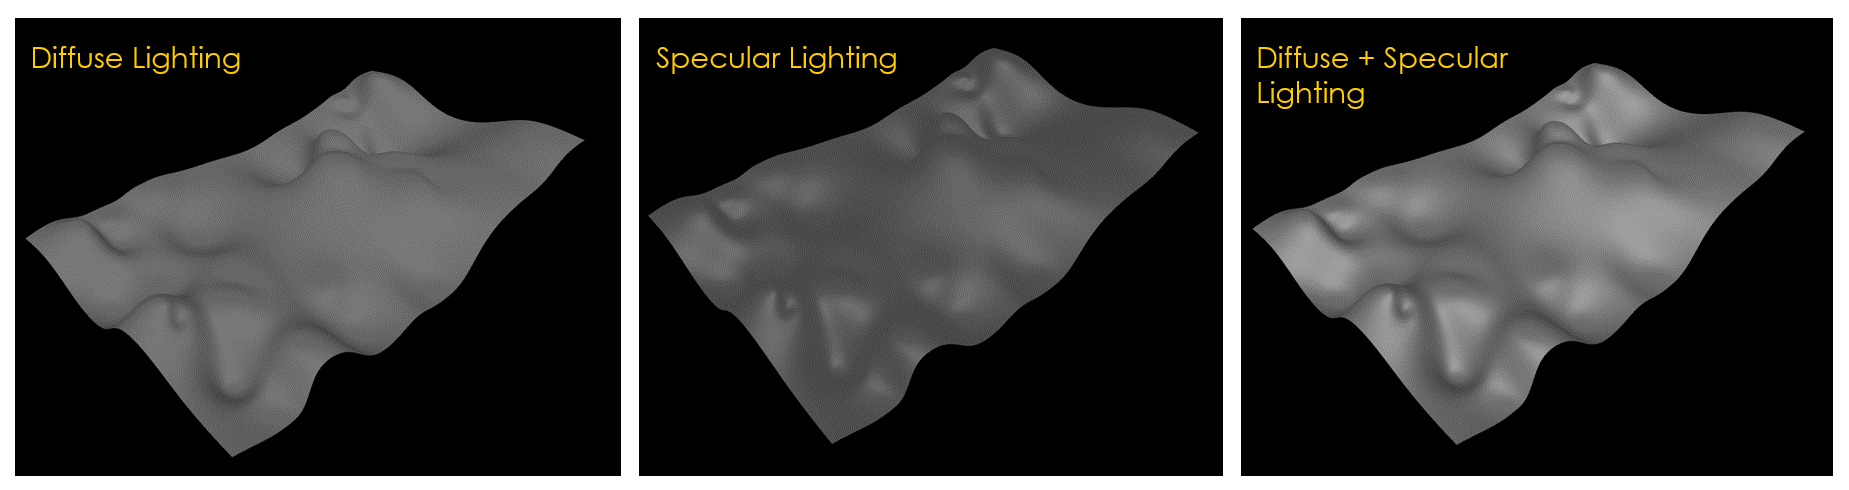
Computation on GPU
Conclusion
JavaScript Charts in R
Written by a human | Updated on April 14th, 2025JavaScript Charts in RIn this article, we will do an exciting exercise in R to analyze a dataset for descriptive statistics and visualize the data trend using the LC4R package. For this example, we will learn how to...
React Scatter Charts
Written by a human | Updated on April 14th, 2025React Scatter ChartsIn today's data-driven world, the ability to effectively visualize and interpret data is crucial for businesses across various industries. Whether you are analyzing complex datasets, tracking trends,...
Contour Plot Essentials
Written by a human | Updated on April 14th, 2025Contour Plot EssentialsContour plots offer an engaging and visually appealing way to present complex data. These tools not only facilitate the exploration and interpretation of spatial data but also allow us to represent...


If you have any questions, feel free to contact us!
©LightningChart Ltd 2026. All rights reserved.