








How to Set Up LightningChart JS in Cursor and Claude Code Using MCP, in Under 5 Minutes
Article

Niilo Keinänen
CTO, LightningChart JS, Team Lead (JS)

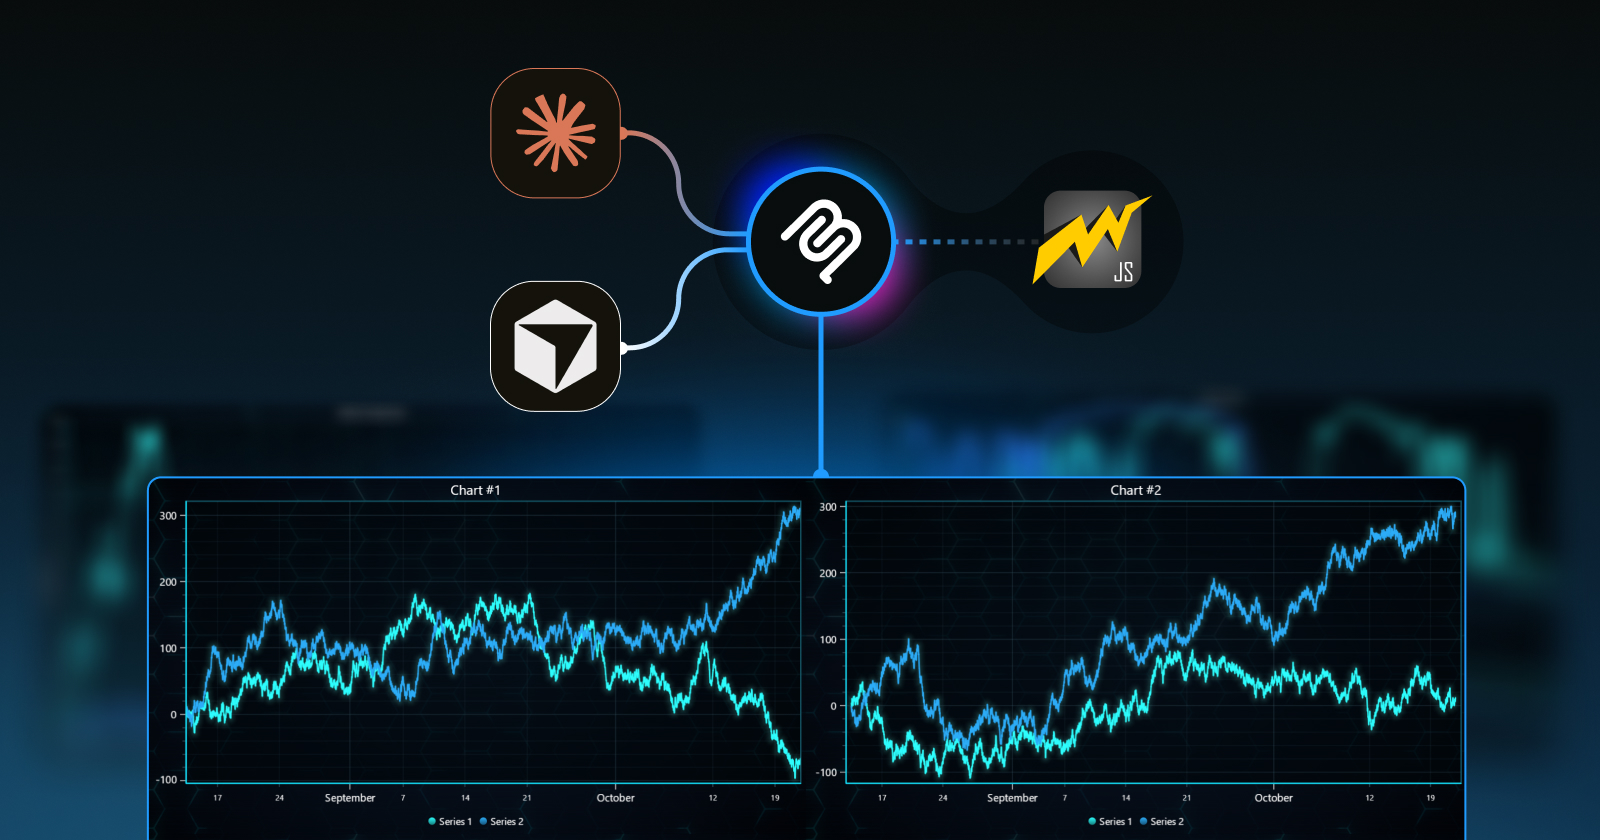
A step-by-step guide to installing the LightningChart JS MCP server so your AI coding agent stops hallucinating chart APIs and starts writing production-ready code from the first prompt.
AI coding agents are good at writing chart code. They are less good at writing correct LightningChart JS code the first time, because they tend to mix up API versions, use the old package name, or copy patterns from Chart.js and D3 that do not translate to LCJS. The MCP server fixes this by giving the agent a reliable, up-to-date starting point before it writes anything.
This guide walks through setup for Claude Code and Cursor. The same server works with Cline, Roo Code, Windsurf, Codex, and any other MCP-compatible tool using the same values.
What the MCP server actually does
When you ask your coding agent to build a chart, it calls get_lightningchart_context from the MCP server. The server returns the official LightningChart JS agent instructions: the correct package name, current best practices, common mistakes to avoid, and pointers to the right documentation. The agent uses this context before generating any code.
In agents that show tool activity, you will see the get_lightningchart_context call happen automatically when the agent decides it needs charting guidance. In agents that do not, adding one sentence to your prompt is enough:
Setup: Claude Code
The fastest method is the CLI one-liner:
claude mcp add lightningchart-js -- npx -y @lightningchart/mcp-server@latestThat is it. Restart Claude Code and open a new session. The server is active.
If you prefer to add it through the config file instead, open ~/.claude/config.json (or the Claude Code settings UI) and add:
{
  "mcpServers": {
    "lightningchart": {
      "command": "npx",
      "args": ["-y", "@lightningchart/mcp-server"]
    }
  }
}
Restart Claude Code after editing the config. Check the MCP server list in settings to confirm lightningchart appears with a green status indicator.
Setup: Cursor
Open Cursor settings and navigate to the MCP section. Click “Add MCP server” and fill in:
Save and restart Cursor. In a new chat, you should see lightningchart listed under available tools.
If Cursor uses a JSON config file in your project (.cursor/mcp.json) rather than the UI, use the same JSON block as the Claude Code config above.
Setup: Cline, Roo Code, Windsurf, and others
Any MCP-compatible agent uses the same config. Find the MCP server configuration in your tool’s settings and add:
{
  "mcpServers": {
    "lightningchart": {
      "command": "npx",
      "args": ["-y", "@lightningchart/mcp-server"]
    }
  }
}
The npx command downloads and runs @lightningchart/mcp-server from npm automatically. You do not need to install it globally.
Verifying it works
Start a new session and ask for a chart:
Ask a prompt that clearly involves charting / data visualization. This can be in plan mode if you don’t want any actual file changes immediately.
Practically all models show progress information and tool activity before printing the final output. During this crunching stage, expand the details to see how they source information for LCJS:
- The agent calls
get_lightningchart_contextbefore generating any code (visible in tool call logs). - It uses
@lightningchart/lcjsas the import, not@arction/LCJS(the old package name). - It asks about or correctly wires a license key.
- It does not mix in Chart.js or Recharts syntax.
For any charting-related task, the agent will pull up the “lightningchart” MCP server for context before starting.
Troubleshooting
The most common issue is the MCP server not appearing after adding the config. Check these in order:
- Did you restart or reload the client? MCP servers are loaded at application startup.
- Is the config in the right file? Claude Code uses
~/.claude/config.json. Cursor uses its own config path. - Is
npxavailable? Runnpx --versionin your terminal to confirm Node.js is installed. - Is it visible in settings? Does the tool list show a
lightningchartserver? If not, the config was not picked up.
The GitHub repo README at github.com/Lightning-Chart/lightningchart-js-mcp-server has a dedicated troubleshooting section covering edge cases for specific clients.
What to try once it is running
A few prompts that work exceptionally well with the MCP server active:
The agent will call get_lightningchart_context on any prompt where it decides LCJS guidance is relevant, which in practice means any prompt that mentions charting, dashboards, or data visualization in a JavaScript or TypeScript project.
Useful Links & Resources
Continue learning with LightningChart
Why AI Coding Agents Get Data Visualization Wrong, and What to Do About It
AI coding assistants are getting good at most parts of application development. Data visualization is one of the areas where they still have a consistent, predictable failure mode. This article explains the mechanics of why it happens and the practical fix. I spent a...
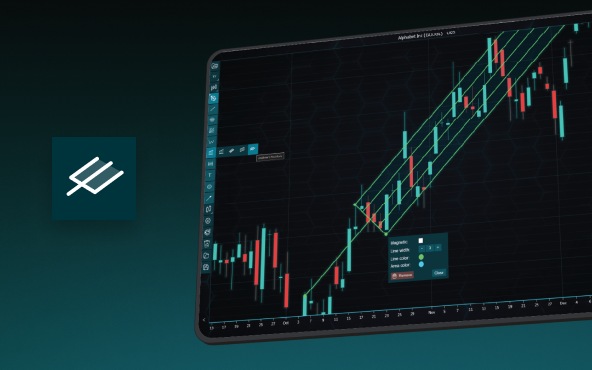
Andrews’ Pitchfork in Technical Analysis
Andrews' Pitchfork is one of the most respected technical analysis tools used by traders to identify potential support and resistance levels, trend direction, and future price paths. Developed by Dr. Alan H. Andrews, the indicator is based on the principle that prices...
React Charting Performance
Here's a scenario that plays out across development teams every few months. Someone builds a React dashboard, picks Recharts or Victory because they're popular, the devs love them, and the first demo looks great. Then the dataset gets bigger. Or the data starts...



If you have any questions, feel free to contact us!



©LightningChart Ltd 2026. All rights reserved.