



Real-time data visualization withWebSockets & LightningChart JS
ArticleData Visualization Real Time with WebSockets & LightningChart JS.
Written by a human | Updated on April 10th, 2025
WebSockets Data Visualization in Real-Time
These days it is ever increasingly common that people require web solutions for their applications and services. Data visualization is not an exception to this, as different graphs, visuals, and charts are continuously being integrated into different web applications and sites.
This blog looks into the interesting use case of real-time data visualization with a large scope, including the logistics of data transfer. In real-time data visualization, the application is monitoring a data source that is updating in real-time – for example, every couple of seconds or even very frequently such as 100 times per second.
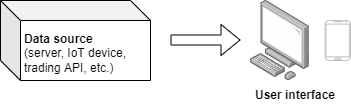
This kind of system can roughly be split into two distinct parts, data transfer…
… and data visualization.
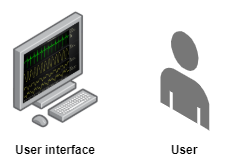
Here at LightningChart, naturally, we are experts in the latter part of data visualization and we have a large collection of examples of how real-time data visualization could be implemented.
In this blog, however, we will be focusing mainly on solving the data transfer problem, for this is not trivial. While data visualization has a history of being “heavy technology”, transferring data can be an equal or even larger technical bottleneck.
WebSocket to the rescue
WebSocket is the real-time communication method on the web – it enjoys wide support and really doesn’t mind what kind of platform it is used on (browsers, Node.js servers, IoT devices, …).

And the best part is WebSockets is super powerful – in our tests with a good network connection, we could transfer more than 1 million data points per second, and even with a really bad network connection (server in the USA, user in Finland) 30 thousand data points per second.
Realistically, this data rate already covers the wide majority of real-time data visualization use cases.
How is it implemented?
WebSocket communication is event-driven and bi-directional, meaning that in the above diagram both the “data server” and “user interface” could initiate communication once the connection is formed.
WebSockets can be used to transfer just about any kind of information imaginable. For simple applications with small data rates, we suggest JSON. You can find here the JSON code example.
As for applications that require transferring large quantities of data, we suggest using binary communication for more efficient bandwidth utilization. You can find here the binary communication example code example.
Long story short…WebSockets Data Visualization
The combination of a real-time web data visualization library (LightningChart JS) and WebSocket data transfer is a power package, which can be used for a wide variety of data visualization applications targeting nearly any kind of user interface device (computer, laptop, phone, etc.).
The WebSocket API assists a bi-directional communication between the user’s browser and a server. In addition, LightningChart has been built for supporting real-time and data-intensive data visualization applications. Using both technologies can result in limitless and high-performance charting applications for the web.


Niilo Keinänen
LightningChart JS CTO


Continue learning with LightningChart

Trend Lines in Trading
Trend lines are among the simplest yet most powerful tools in technical analysis. They help traders visualize market direction, identify potential support and resistance levels, and make more informed trading decisions. Despite their simplicity, trend lines remain a...
Best Python Charting Library in 2026
Python's charting ecosystem is large, overlapping, and regularly misunderstood. Most comparison guides stop at Matplotlib, Plotly, and Seaborn. This one goes further: it covers what happens when your datasets grow large, your update rates increase, or your chart types...
Best TradingView Charting Library Alternative
TradingView's charting libraries are the most visible option for fintech developers. Visibility is not the same as capability. This guide is for developers who have hit the wall on candle count limits, watermark restrictions, branding requirements, real-time...



If you have any questions, feel free to contact us!



©LightningChart Ltd 2026. All rights reserved.





