


AndroidCreate a cardiac mobile cardiovascular application in Android
TutorialUse LightningChart JS to build your own cardiac mobile cardiovascular application in Android.
Written by a human | Updated on April 14th, 2025
Cardiac Mobile Cardiovascular Application in Android
Let’s keep diving into telemetry topics. This time we’ll create a cardiac mobile cardiovascular application using Android 11 and LightningChart JS. In the rapidly evolving landscape of healthcare, mobile applications have become invaluable tools for monitoring and managing medical data. Our goal is to simulate a medical telemetry application, complete with electrocardiograms (ECG) represented as XY charts.
If you’re new to mobile development, don’t worry, I’ll guide you through setting up Android Studio, configuring essential components, and understanding the intricacies of creating visually compelling and informative charts right on your phone.
Project Overview
This month, we heavily focus on covering the topic of medical telemetry. In this article, we will do an exercise simulating a cardiac mobile cardiovascular application that uses telemetry. We will use two types of XY charts to simulate a medical electrocardiogram (ECG) app:
In this exercise, we’ll use Android Studio, and I suggest you follow the Android installation as shown in this article. After the installation, your PC will be ready for development with Android Studio. So, let’s get started.

 Download the project to follow the tutorial
Setting Up Android Studio
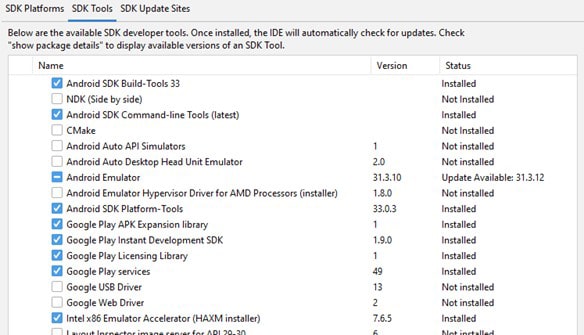
Android Studio is a free IDE, so you will have the opportunity to work with it on Windows, macOS, and Linux. You can download Android Studio here. The installation is very easy, it’s a typical “next” window, but if you want to see the official Android documentation, you can get it from here. Finally, go to the SDK manager and install the latest platforms for android:

You can install all the platforms you need, but I recommend having the latest ones because it will be a requirement in case you want to publish your Android charts app in the Google Play console.
To finish setting up Android Studio, install the SDK Tools for Android. You can download the tools that I show or choose the tools you need.
Java SDK
The next important thing is to install the latest Java SDK. For this installation, you will have to go to the official Oracle website. It would be necessary to create an account.
Gradle
Gradle is a build automation tool for multi-language software development. So, Gradle will be very important for mobile applications. You can get and see the installation documentation from here. The Gradle installation is basically copying the source files to the specified paths.
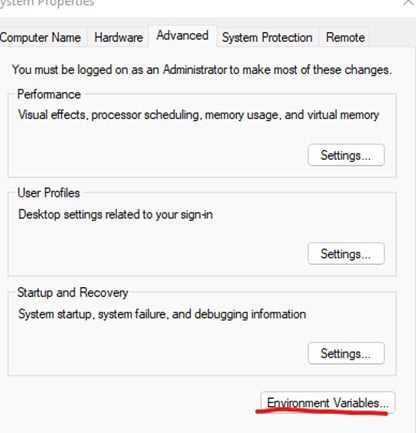
Environment Variables
It will be necessary to create the environment variables for Android Studio, Java SDK, and Gradle. You can go directly to the environment variables by typing those words in the windows menu:

Then, click on the [Environment Variables] button:
Now you just need to add the variables with the path for the android SDK:

Now, go to the System Variables section and edit the [Path] variable:
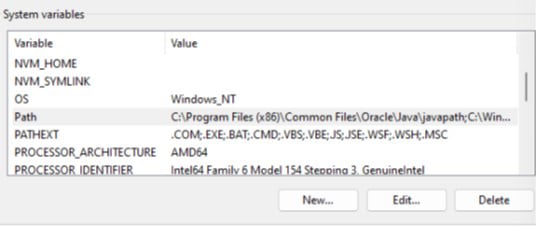
Finally, just add the path for Java and the path for Gradle and proceed to code in Android Studio:

Android Project
When you open the app folder in the Android studio, you will see a tree like the following. I will now explain folder by folder and the relationship between the classes and the HTML files.

Manifests – AndroidManifest.xml
Every app project must have an AndroidManifest.xml file at the root of the project source set. The manifest file describes essential information about your app to the Android build tools, the Android operating system, and Google Play.
<application
        android:requestLegacyExternalStorage="true"
        android:allowBackup="true"
        android:icon="@mipmap/ic_launcher"
        android:label="@string/app_name"
        android:roundIcon="@mipmap/ic_launcher_round"
        android:supportsRtl="true"
        android:theme="@style/AppTheme">
        <activity android:name=".ECGChart" android:exported="false"></activity>
        <activity android:name=".SweepingECGChart" android:exported="false"></activity>
        <activity android:name=".MainActivity" android:exported="true">
            <intent-filter>
                <action android:name="android.intent.action.MAIN" />

                <category android:name="android.intent.category.LAUNCHER" />
            </intent-filter>
        </activity>
    </application>
Inside the manifest, we need to specify the classes that will render a window inside our application. If you go to the java/lightningChart folder, you will see some files/classes with the same name that we have in the Android manifest.
Those names should match each class that we create and want to render. The manifest file is a very important file, in the future, you will use this file to specify many settings, for example, deep linking properties.
Java / LightningChart

Inside each file, we can create functions to validate, modify, or create elements to be shown in the window. By default, you will find the onCreate function:
protected void onCreate(Bundle savedInstanceState) {
        super.onCreate(savedInstanceState);

        setContentView(R.layout.activity_chart_display);
        final Bundle bundle = getIntent().getExtras();
The onCreate method will be called when the activity is created. In other words, when we click on a button that references a specific action, the onCreate method will be called. Inside this method, we can load an HTML file (this file can work as a UI). We are accessing the HTML as a “view” for this “controller”, using the Android WebView class.
The WebView component permits the integration of web content into your activity layout, albeit with certain limitations compared to complete web browsers. If you require more extensive UI control and advanced configuration options to incorporate web pages into a custom app environment, a WebView proves advantageous.
JSON files
For both charts, we need to create two JSON files. These JSON files will contain the data points that will simulate the behavior of heartbeats. We will use the InputStream class to store the JSON object from the data.json file.
String json = null;
        try {
            InputStream is = getAssets().open("ECGData.json");
            int size = is.available();
            byte[] buffer = new byte[size];
            is.read(buffer);
            is.close();
            json = new String(buffer, "UTF-8");
        } catch (IOException ex) {
            ex.printStackTrace();
        }
The method will apply to both charts.
webView = findViewById(R.id.chartDisplayWebView);
        webView.getSettings().setJavaScriptEnabled(true);
        String finalJson = json;
        webView.setWebViewClient(new WebViewClient() {
            public void onPageFinished(WebView view, String url) {

                view.loadUrl("javascript:createECGChart('" + finalJson + "')");
            }
        });
        webView.loadUrl("file:///android_asset/ECGChart.html");
Once the page is loaded, the JavaScript method createECGChart will be executed. The argument for this method will be the JSON object obtained from the JSON file. The loadURL function, specifies the HTML body that we want to load. In this case ECGChart.html will contain the LightningChart JavaScript implementation as an embedded code.
Java / LightningChart / MainActivity
The MainActivity will work as our main() method. This component is the first screen to appear when the user launches the app. From this file, we will declare the methods that will execute our activities. These methods can be executed by pressing a UI object:
public void createSweepingECGChart(View view) {
        Intent intent = new Intent(this, SweepingECGChart.class);
        Bundle bundle = new Bundle();
        bundle.putBoolean("useRandom", true);
        intent.putExtras(bundle);
        startActivity(intent);
    }
Layout
When creating a new project, we will find some XML files inside the Layout folder:
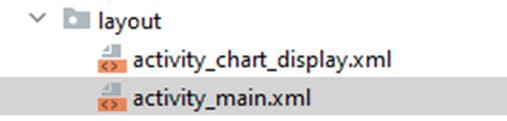
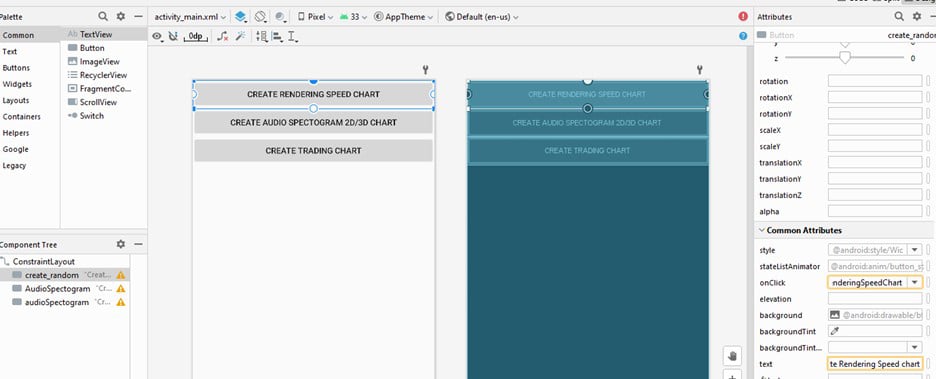
The activity_main.xml will work as a default interface and it will be related to our MainActivity class. If you open the file, you will see a designer that contains the buttons for each chart.
Here you can add UI controls. If you click on each button, you will see the properties panel at the right of the window. In the text property, you can set the text to be displayed in the application.
In the onClick property, you can specify the name of the method that will call an activity. This method should be located in the MainActivity class.
Assets Folder
In this folder, you will find the HTML files that will be loaded for creating the cardiac mobilei cardiovascular app. The IIFE.js files contain all the functions and properties needed to create LC JS charts.
The xydata.iife.js file contains the classes to create XY charts, this is required for the sweeping line chart. Finally, the JSON files contain the heart beats data points.

Electrocardiogram Chart (ECG)
This will be the first chart to include in the cardiac mobile cardiovascular app. In this example, we have simulated an ECG data set that includes voltage measurements from a heart over a short period of time.
This data is visualized as a Line Chart where the X dimension represents the time and the Y dimension measured the voltage. Here you can find the ECG chart base code used for this example.
LightningChart JS can work as embedded code, wrapped within script tags:
<script src="lcjs.iife.js"></script>

<!--Actual chart related script tag-->
Extracting the required classes for the ECG chart
const { lightningChart, PalettedFill, LUT, ColorRGBA, AxisTickStrategies, Themes } = lcjsCreating the XY chart
const chart = lightningChart()
    .ChartXY({
        theme: Themes.darkGold,
    })
    .setTitle('ECG chart with color highlighted heart beats')

const axisX = chart.getDefaultAxisX().setTickStrategy(AxisTickStrategies.Time)

const axisY = chart.getDefaultAxisY().setTitle('mV')
The theme property determines how your cardiac mobile cardiovascular app will look in the end device. I recommend reviewing the catalog of themes and experimenting with any of them.
Its possible to have access to X and Y axes by using the getDefaultAxis method. Once we have an instance of each axis, we can set properties.
- setTickStrategy. The setTickStrategy defines the positioning and formatting logic of the Axis ticks as well as the style of created ticks.
Adding Line series
const lineSeries = chart
            .addLineSeries({
                dataPattern: {
                    pattern: 'ProgressiveX',
                },
            })
.addArrayY(ecgValuesY)- The
addLineSerieswill help you add a series to the chart object.
- The
addArrayYproperty appends new data points into the series by only supplying Y coordinates. Each Y coordinate will be paired with an automatically generated X coordinate. By default, this continues from the last data point in the series. However, the behavior of assigning X coordinates can be controlled with the optional step and start parameters. Read more about addArrayY.
- The data pattern is a selection from a collection of preset options:
ProgressiveX= every data point X value is higher than the previous one’s X value.ProgressiveY= every data point’s Y value is higher than the previous ones’ Y value.RegressiveX= every data point X value is lower than the previous one’s X value.RegressiveY= every data point X value is lower than the previous one’s Y value.
ecgValuesY: parsed JSON argument.
const ecgValuesY = JSON.parse(data);Detect heartbeats
We will detect the heat beats from the cardiac mobile cardiovascular app dataset by listing the ranges as X coordinates (data point indexes).
const beats = []
        let yPrev
        let iPeakHigh
        let iPeakLow
        for (let i = 0; i < ecgValuesY.length; i += 1) {
            const y = ecgValuesY[i]
            if (iPeakHigh === undefined) {
                // Check for high peak.
                if (y > 700 && y < yPrev) {
                    // High peak.
                    iPeakHigh = i
                }
            } else if (iPeakLow === undefined) {
                // Check for low peak.
                if (y < -700 && y > yPrev) {
                    iPeakLow = i
                    // Mark beat range as data point indexes.
                    beats.push({ iStart: iPeakHigh - 40, iEnd: iPeakLow + 120 })
                    iPeakHigh = undefined
                    iPeakLow = undefined
                }
            }
            yPrev = y
        }
Style LineSeries
Now we will style the line series so that the heartbeat X ranges are highlighted with a special color.
const colorDefault = lineSeries.getStrokeStyle().getFillStyle().getColor()
        const colorNormal = colorDefault
        const colorHighlight = new ColorRGBA(0, 255, 0)
        const xPalette = new PalettedFill({
            lookUpProperty: 'x',
            lut: new LUT({
                interpolate: false,
                steps: [
                    { value: 0, color: colorNormal },
                    ...beats
                        .map((beat) => [
                            { value: beat.iStart, color: colorHighlight },
                            { value: beat.iEnd, color: colorNormal },
                        ])
                        .flat(),
                ],
            }),
        })
LUT Property
This is the style class for describing a table of colors with associated lookup values (numbers). The instances of the LUT, like all LCJS style classes, are immutable, meaning that its setters don’t modify the actual object, but instead return a completely new modified object.
- Properties of LUT.
Steps. List of color steps (color + number value pair).Interpolate. True enables automatic linear interpolation between color steps.
Sweeping ECG Chart
The Sweeping Line Chart functionality is not inherently included in the library. Nevertheless, you can create high-performance and visually engaging Sweeping Line applications using LightningChart JS.
While the performance remains unaffected, the application’s code becomes somewhat more intricate compared to using scrolling axes. Some built-in features, such as real-time axis ticks and glow effects, are also not applicable in this context.
In the provided example, you can see six ECG channels, each operating at a frequency of 1000 Hz. Stress testing has confirmed that even when displaying hundreds of such high-frequency channels simultaneously, performance remains robust. To maximize GPU performance, consider setting the line series thickness to -1 for optimal results.
Creating the channels
X_VIEW_MS will help us determine the duration of the ECG strip until it is clipped.const CHANNELS = [
{ name: 'ECG-1', yMin: -2500, yMax: 2500 },
{ name: 'ECG-2', yMin: -2500, yMax: 2500 },
{ name: 'ECG-3', yMin: -2500, yMax: 2500 },
{ name: 'ECG-4', yMin: -2500, yMax: 2500 },
{ name: 'ECG-5', yMin: -2500, yMax: 2500 },
{ name: 'ECG-6', yMin: -2500, yMax: 2500 },
]
const X_VIEW_MS = 15 * 1000Creating the dashboard
This chart has multiple channels and each of them refers to an independent chart. To load multiple charts within the same window, we need to use a dashboard. Each channel is a new row, so the number of rows will depend on the length of the channel array.
const dashboard = lightningChart()
            .Dashboard({
                numberOfColumns: 1,
                numberOfRows: CHANNELS.length,
                theme: Themes.darkGold,
            })
            .setSplitterStyle(emptyLine)
        console.log(dashboard)
        const theme = dashboard.getTheme()
        const ecgBackgroundFill = new SolidFill({
            color: theme.isDark ? ColorHEX('#000000') : ColorHEX('#ffffff'),
        })
Creating the chart object
We can specify what UI theme we want for the chart. The container property will point to an HTML object. This HTML object will be a DIV that will render the chart.
const chart = lightningChart().ChartXY({
    theme: Themes.turquoiseHexagon,
    container: 'target'
})
Configuring the channels
We will use the map method to recreate the configuration for each channel.
const channels = CHANNELS.map((info, iCh) => {
            const chart = dashboard
                .createChartXY({
                    columnIndex: 0,
                    rowIndex: iCh,
                })
                .setTitle(info.name)
                .setTitlePosition('series-left-top')
                .setAutoCursorMode(AutoCursorModes.disabled)
                .setSeriesBackgroundFillStyle(ecgBackgroundFill)
                .setMouseInteractions(false)
                .setSeriesBackgroundStrokeStyle(emptyLine)
Adding axis properties
The interval of the X-axis will depend on the X_VIEW_MS value whereas the Y-axis depends on the values that we specified in the array min-max properties.
const axisX = chart
                .getDefaultAxisX()
                .setTickStrategy(AxisTickStrategies.Empty)
                .setStrokeStyle(emptyLine)
                .setScrollStrategy(undefined)
                .setInterval({ start: 0, end: X_VIEW_MS, stopAxisAfter: false })

            const axisY = chart
                .getDefaultAxisY()
                .setStrokeStyle(emptyLine)
                .setInterval({ start: info.yMin, end: info.yMax })
                .setTickStrategy(AxisTickStrategies.Empty)
Series for displaying “old” data.
const seriesRight = chart
                .addLineSeries({
                    dataPattern: { pattern: 'ProgressiveX' },
                    automaticColorIndex: iCh,
                })
                .setName(info.name)
                .setStrokeStyle((stroke) => stroke.setThickness(2))
                .setEffect(false)
Rectangle for hiding “old” data under incoming “new” data.
const seriesOverlayRight = chart
                .addRectangleSeries()
                .setEffect(false)
                .add({ x1: 0, y1: 0, x2: 0, y2: 0 })
                .setFillStyle(ecgBackgroundFill)
                .setStrokeStyle(emptyLine)
                .setMouseInteractions(false)
Series for displaying new data
const seriesLeft = chart
                .addLineSeries({
                    dataPattern: { pattern: 'ProgressiveX' },
                    automaticColorIndex: iCh,
                })
                .setName(info.name)
                .setStrokeStyle((stroke) => stroke.setThickness(2))
                .setEffect(false)
White Point
const seriesHighlightLastPoints = chart
                .addPointSeries({ pointShape: PointShape.Circle })
                .setPointFillStyle(new SolidFill({ color: theme.examples.highlightPointColor }))
                .setPointSize(5)
                .setEffect(false)
Insert new data into the sweep chart
Now, we’ll do the configuration logic to insert new data points into the sweep chart. LightningChart JS does not provide built-in functionality for sweep line charts, but a high-performance chart can be implemented, with a bit of additional application complexity. Keep track of data pushed to each channel:
const channelsNewDataCache = new Array(CHANNELS.length).fill(0).map((_) => [])
        const appendDataPoints = (dataPointsAllChannels) => {
The last X (time position) is tracked, set to the range of the sweep axis.
let posX = 0

            for (let iCh = 0; iCh < CHANNELS.length; iCh += 1) {
                const newDataPointsTimestamped = dataPointsAllChannels[iCh]
                const newDataCache = channelsNewDataCache[iCh]
                const channel = channels[iCh]
Incoming data points are timestamped, which means that their X coordinates can go outside the range of the sweep axis. Set timestamps in the range of the sweep axis:
const newDataPointsSweeping = newDataPointsTimestamped.map((dp) => ({
                    x: dp.x % X_VIEW_MS,
                    y: dp.y,
                }))

                posX = Math.max(posX, newDataPointsSweeping[newDataPointsSweeping.length - 1].x)
It is checked if the channel completes a full sweep (or even more than 1 sweep even though it cannot be displayed).
let fullSweepsCount = 0
                let signPrev = false
                for (const dp of newDataPointsSweeping) {
                    const sign = dp.x < prevPosX
                    if (sign === true && sign !== signPrev) {
                        fullSweepsCount += 1
                    }
                    signPrev = sign
                }
The following algorithm is unable to handle data input that spans multiple full data sweeps. This scenario is triggered by switching tabs or minimizing the sample for long periods of time.
if (fullSweepsCount > 1) {
                    channel.seriesRight.clear()
                    channel.seriesLeft.clear()
                    newDataCache.length = 0
Copy the data from the “left” series to the “right” series, delete the “left” series. Categorize new data points into the “right” and “left” sides.
} else if (fullSweepsCount === 1) {
                    const newDataPointsLeft = []
                    for (const dp of newDataPointsSweeping) {
                        if (dp.x > prevPosX) {
                            newDataCache.push(dp)
                        } else {
                            newDataPointsLeft.push(dp)
                        }
                    }
                    channel.seriesRight.clear().add(newDataCache)
                    channel.seriesLeft.clear().add(newDataPointsLeft)
                    newDataCache.length = 0
                    newDataCache.push(...newDataPointsLeft)
If count is not major to 1, Add data to the left. While extremely powerful, this syntax can fail if called with extremely large arrays (at least 100,000 elements).
} else {
                    channel.seriesLeft.add(newDataPointsSweeping)
                    newDataCache.push(...newDataPointsSweeping)
                }
Highlight the last data point
const highlightPoints = [
                    newDataCache.length > 0
                        ? newDataCache[newDataCache.length - 1]
                        : newDataPointsSweeping[newDataPointsSweeping.length - 1],
                ]
                channel.seriesHighlightLastPoints.clear().add(highlightPoints)
Move overlays of old data to right locations
const overlayXStart = 0
            const overlayXEnd = posX + X_VIEW_MS * 0.03
            channels.forEach((channel) => {
                channel.seriesOverlayRight.setDimensions({
                    x1: overlayXStart,
                    x2: overlayXEnd,
                    y1: channel.axisY.getInterval().start,
                    y2: channel.axisY.getInterval().end,
                })
            })

            prevPosX = posX
Setup example data streaming
let tStart = window.performance.now()
        let pushedDataCount = 0
        const dataPointsPerSecond = 1000 // 1000 Hz
        const xStep = 1000 / dataPointsPerSecond
        const streamData = () => {
            const tNow = window.performance.now()
NOTE: This code is for example purposes only (streaming stable data rate). In real use cases, data should be pushed in when it comes:
const shouldBeDataPointsCount = Math.floor((dataPointsPerSecond * (tNow - tStart)) / 1000)
            const newDataPointsCount = shouldBeDataPointsCount - pushedDataCount
            if (newDataPointsCount > 0) {
                const newDataPoints = []
                for (let iDp = 0; iDp < newDataPointsCount; iDp++) {
                    const x = (pushedDataCount + iDp) * xStep
                    const iData = (pushedDataCount + iDp) % ecgData.length
                    const y = ecgData[iData]
                    const point = { x, y }
                    newDataPoints.push(point)
                }

                // For this examples purposes, stream same data into all channels.
                appendDataPoints(new Array(CHANNELS.length).fill(0).map((_) => newDataPoints))
                pushedDataCount += newDataPointsCount
            }

            requestAnimationFrame(streamData)
Running the App
There are two ways to execute the application:
- Using an Android emulator
- Connecting a real Android device to the PC.
The Android emulator could be the fastest option, but you will need to have enough RAM memory and Disk space. To configure a virtual device, go to tools->Device Manager-> Create Device:

Then just select the device you need, download, and install it. But if you have an Android device, I recommend using it… emulators can slow down your computer and you won’t have all the capabilities to test. Also, some features may not work properly in the emulator.
If you want to use a real device, you will have to activate the developer options on your phone. After that, connect your phone to your PC, and the Android Studio will set your device as a “Physical Device”. You can connect your physical phone to Android Studio by selecting either of the options available in the drop-down list, e.g., using Wi-Fi:
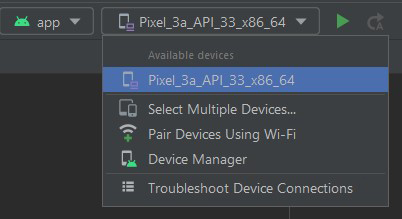
On your phone, go to Developer Options > Wireless Debugging > Pair Using QR/pairing code and search for “Wireless Debug”. From there, you can connect your phone over the Wi-Fi by pairing it with Android Studio using the QR code in Android Studio or the pairing code.
Your Android Studio application project will launch on your phone just like any other app. Here is the final result. I’m using a Samsung device and as you can see, the Android charting application runs smoothly. For additional information about using JavaScript charts in Android with LightningChart JS, visit the GitHub repository.
Conclusion
In conclusion, this blog post has provided a comprehensive overview of setting up Android Studio for developing a cardiac mobile cardiovascular app with Lightning Charts JS. We’ve covered the installation process for Android Studio, Java JDK, and Gradle, as well as configuring environment variables.
The post also delved into the structure of an Android project, explaining the significance of the manifest file and how it relates to the app’s classes. Furthermore, it detailed the key components of the app, including the layout, assets, and charts. The ECG Chart and Sweeping ECG Chart functionalities were explained in depth, emphasizing the importance of data visualization in the medical telemetry application.
Finally, the post provided insights into running the app, offering options for both Android emulators and physical devices, with considerations for the emulator’s resource requirements and the benefits of using a real device for testing.
Overall, this guide offers a valuable starting point for developers looking to create a medical telemetry app using Android Studio and Lightning Charts JS, with a focus on visualizing cardiac data effectively.

Omar Urbano
Software Engineer
Continue learning with LightningChart

The Head and Shoulders Pattern in Technical Analysis
The Head and Shoulders Pattern in Technical Analysis The Head and Shoulders Pattern in Technical Analysis The Head and Shoulders pattern is one of the most recognized and widely used chart patterns in technical analysis. It is considered a reliable reversal pattern...

Best Telerik Charts Alternative in 2026: GPU Performance for WPF, WinForms, and Web
Telerik from Progress is a comprehensive UI component suite covering WPF, WinForms, ASP.NET, Blazor, and JavaScript. The charting components: RadChartView for WPF and WinForms, and Kendo UI Charts for web and Blazor, arrive bundled with the suite purchase. For teams...

Streaming Data Visualization with WebSockets (2026): The Complete Tutorial
Every WebSocket tutorial on the internet shows the same thing: a server sends a random number every second, a chart updates. It works. The demo looks great. Then you deploy to production, your IoT sensors push 800 updates per second across twelve channels, and the...


If you have any questions, feel free to contact us!
©LightningChart Ltd 2026. All rights reserved.