








Best TradingView Charting Library Alternative in 2026: The Developer's Honest Guide
Article
TradingView’s charting libraries are the most visible option for fintech developers. Visibility is not the same as capability. This guide is for developers who have hit the wall on candle count limits, watermark restrictions, branding requirements, real-time performance, or platform coverage, and want to know what actually solves those problems.
In this article
- TradingView the platform vs TradingView the charting library
- Why developers look for alternatives
- The alternatives worth evaluating
- Feature-by-feature comparison
- Performance: where each library breaks
- Licensing and cost analysis
- Which library wins by use case
- Migrating from TradingView to LightningChart Trader
- Frequently asked questions
If you are a developer building a trading platform, financial dashboard, or fintech application, TradingView’s charting libraries probably came up early in your research. They are well-known, broadly documented, and carry a brand traders already trust. It is natural to start there.
What is less obvious until you start building is where TradingView’s charting libraries stop. A hard ceiling on visible bars. A watermark that requires enterprise-level negotiation to remove. A widget model that limits how deeply you can customize what users see and do. No Python. No 3D charts.
This article is a practical guide for developers who have found those limits and need to understand what comes next.
1. TradingView the Platform vs TradingView the Charting Library
Before any comparison, a critical distinction: TradingView refers to two completely different things depending on context.
TradingView the platform is the consumer product used by tens of millions of retail traders worldwide. It is a browser-based trading terminal with charting, social features, Pine Script, screeners, and market data. It is excellent at what it does. Comparisons between TradingView, MetaTrader, Bloomberg Terminal, or Koyfin are evaluating this product.
TradingView the charting libraries are three separate developer tools:
- Lightweight Charts (open source, Apache 2.0): a compact library for basic candlestick and line charts. Around 35KB minified. No indicators included. Good for simple price display embeds.
- Advanced Charts (proprietary, commercial): a full technical analysis chart widget with indicators, drawing tools, and the familiar TradingView interface. Requires the TradingView watermark unless enterprise removal is negotiated. Bar display is capped at approximately 4,000 per chart.
- Trading Platform (proprietary, commercial): the full terminal experience with order management integration, designed primarily for brokers connecting a live OMS. The most feature-complete but the most locked-in product in the range.
When developers search for a TradingView charting library alternative, they are almost always looking for something to replace Advanced Charts, because that is where the production blockers live.
2. Why Developers Look for Alternatives
The bar count ceiling
This is the most commonly cited technical blocker. Institutional terminals, algo trading tools with backtesting visualization, crypto applications, and any application where users need to view extended intraday history all hit TradingView Advanced Charts’ 4,000-bar limit within days of going to production. The bar count ceiling is not a setting. There is no workaround.
The watermark
Advanced Charts displays the TradingView brand on every chart. Removing it requires negotiating enterprise terms. For any product where appearing to be “powered by TradingView” creates a positioning problem or where brand consistency is part of the product value, this restriction is a non-starter that many teams only discover after their prototype is already built.
Customization limits
TradingView Advanced Charts is a widget. The UI paradigm is fixed. You can change colors and toggle some features, but you cannot build chart types that do not exist in the library, fundamentally change the interaction model, or create bespoke visualization components on top of the rendering engine. For developers who need a genuinely distinctive product, the widget ceiling arrives quickly.
No Python support
TradingView’s charting libraries are JavaScript only. Quant researchers, data scientists, and algo traders who work in Python will find it virtually impossible to integrate TradingView’s charting tools into their native workflows without significant workarounds. While AI tools and scripting bridges can sometimes bridge the gap, it remains a friction-heavy path. For anyone building a backtesting visualization, a research notebook with live charts, or a Python-based trading analytics tool, TradingView is a poor fit. This eliminates it from a significant share of professional financial application development.
No 3D financial charts
Volatility surface visualization, multi-asset 3D scatter for portfolio analysis, and 3D correlation matrices are increasingly standard requirements in institutional and quantitative finance tools. TradingView’s library set does not include 3D chart types at all.
Real-time performance at scale
TradingView Advanced Charts uses HTML5 Canvas rendering, which is CPU-bound. For dashboards with many simultaneous live charts, high-frequency tick data, or continuous real-time streaming at hundreds of updates per second, Canvas rendering degrades in ways that GPU-accelerated libraries do not.
3. The Alternatives Worth Evaluating
LightningChart Trader TOP PICK
Founded in 2007 in Finland and the pioneer of GPU-accelerated charting libraries, LightningChart Trader is purpose-built for financial and trading applications. TradingView was founded in 2011. LightningChart was already building GPU-accelerated chart technology four years earlier. The result is a library that uses WebGL to render natively on the GPU, handles billions of data points with no candle count ceiling, and is fully white-labeled on paid plans across every license tier. Available in JavaScript, Python, and .NET, covering web applications, quant research notebooks, backtesting tools, and data science workflows from a single product family. Includes 100 plus technical indicators, 33 drawing tools, DataGrid with spark charts, GeoMaps, and the only full GPU-accelerated 3D chart suite in the financial charting market. LightningChart Python Trader brings the same engine and feature set natively to Python with NumPy and Pandas integration.
Highcharts Stock
Established JavaScript charting library with a dedicated stock module. Solid documentation, wide framework support, 40 plus technical indicators, good community. SVG-based rendering, which works well at moderate data volumes but degrades at large datasets or high-frequency real-time updates. No 3D financial charts. Highcharts does offer a Python API on PyPI (highcharts-stock) that wraps the JavaScript library, though it renders in a browser context rather than as a native Python charting engine. Watermark-free on commercial license. A reasonable choice for standard business reporting dashboards with modest data requirements.
DXcharts (Devexperts)
DXcharts Lite is open source. DXcharts Pro is the commercial product. Canvas-based rendering. Covers standard technical analysis chart types and is actively maintained. A reasonable middle ground for teams that want a free entry point with a commercial upgrade path. Lacks 3D, lacks a native Python product, and does not offer the performance benefits that dedicated WebGL GPU rendering provides. Best suited for broker applications integrating with Devexperts’ broader trading infrastructure ecosystem.
Recharts
Popular React charting library built on D3 and SVG. Not purpose-built for financial applications but widely used for financial dashboards given how familiar it is to React developers. SVG rendering means serious performance constraints at high data volumes. No candlestick or OHLC types natively. No indicators or drawing tools. Best for simple financial dashboard UIs inside React applications where data volume is low and the developer team is already deep in the React ecosystem.
TradingView Lightweight Charts
Open source (Apache 2.0) from TradingView themselves. A compact library for basic candlestick and line chart display. The right choice for blog embeds, portfolio display pages, and simple price widgets where no indicators or drawing tools are needed. Becomes limiting the moment requirements grow beyond basic price display.
4. Feature-by-Feature Comparison
| Feature | LightningChart Trader | TradingView Advanced Charts | Highcharts Stock | DXcharts Pro | Recharts |
|---|---|---|---|---|---|
| Rendering engine | WebGL (GPU) | HTML5 Canvas (CPU) | SVG (CPU) | Canvas (CPU) | SVG (CPU) |
| Max bars / candles | No practical limit | ~4,000 bars | No stated limit (degrades at scale) | No stated limit (degrades at scale) | Very low (SVG DOM constraint) |
| Real-time 60 FPS | Yes, 1000+ charts in real-time | Limited | Moderate | Moderate | Low |
| Technical indicators | 100 plus | 100 plus (fixed set, non-extensible) | 40 plus | 30 plus | None native |
| Drawing tools | 33 incl. Fibonacci, Andrews Pitchfork, Channels | 80 plus | Annotations only | 30 plus | None |
| Chart types (financial) | Candlestick, OHLC, Heikin-Ashi, Renko, Kagi, Point and Figure, Mountain, Line, Baseline | Candlestick, Bar, Line, Area, Heikin-Ashi, Renko, Kagi, Point and Figure | Candlestick, OHLC, Line, Area, Baseline | Candlestick, Bar, Line, Area, Baseline | Line, Bar, Area (no candlestick native) |
| 3D financial charts | Full GPU 3D suite (surface, scatter, bar, line, mesh) | None | None | None | None |
| DataGrid | Yes (native, with spark charts) | No | No | No | No |
| GeoMaps | Yes | No | Separate Highmaps product | No | No |
| White-label / watermark | LC Trader logo shown by default, removable on paid plans | TradingView watermark, enterprise removal only | Watermark-free on commercial license | Watermark-free on Pro license | Logo attribution required (Apache 2.0) |
| JavaScript | Yes | Yes | Yes | Yes | Yes (React only) |
| Python | Yes (LightningChart Python Trader) | No | No | No | No |
| Python and .NET support | Yes (Python Trader + .NET) | No | No | No | No |
| Free trial | 30 days, full feature set, no card required | Apply for access (companies only) | 30-day trial | Open source Lite version | Always free (MIT) |
5. Performance: Where Each Library Breaks
In financial charting, performance is not an aesthetic concern. A chart that freezes when a market event arrives, a terminal that drops frames during volatile trading sessions, or a dashboard that takes four seconds to load three months of intraday history all have direct consequences for users who are making time-sensitive decisions.
The rendering architecture gap is the key variable. Modern browsers do apply some GPU acceleration to Canvas and SVG operations, but this is general-purpose compositing rather than dedicated geometry processing. TradingView Advanced Charts, Highcharts Stock, and Recharts rely on this general browser path. LightningChart Trader uses WebGL to put rendering directly onto the GPU with dedicated shader programs designed specifically for high-density data visualization. The difference is not a matter of optimization settings. It is the difference between borrowing GPU resources through a general compositor and owning the GPU pipeline end to end. At low data volumes both approaches look similar. At high volumes, the WebGL path scales and the Canvas path hits a ceiling.
TradingView Advanced Charts maximum bars per chart
LightningChart Trader sustained at 240M data points per frame
LightningChart Trader live charts simultaneously in real time
Scenario 1: Five years of 1-minute OHLCV data
Five years of 1-minute data for a single instrument is approximately 2.6 million bars. LightningChart Trader renders this dataset in under 200 milliseconds with smooth interactive zoom and pan at 60 FPS. TradingView Advanced Charts displays the most recent 4,000 bars and ignores the rest regardless of what data you feed it. The data is there. The library simply does not render it. Highcharts Stock and DXcharts will attempt to render larger datasets but show measurable frame rate degradation past 100,000 to 200,000 points due to SVG and Canvas rendering constraints.
Scenario 2: Multi-chart real-time dashboard at high frequency
A trading terminal showing 20 instruments simultaneously at tick-level update rates generates thousands of data points per second across charts. LightningChart Trader handles this at 60 FPS using GPU-parallel rendering and circular buffer management that keeps memory bounded. CPU-based Canvas and SVG libraries at this update density begin dropping frames because repaint operations compete for the same CPU thread as application logic.
Scenario 3: Order book depth visualization
Real-time order book depth with hundreds of active price levels updating several times per second is one of the most demanding financial chart types. LightningChart Trader’s real-time heatmap and scrolling chart types are built for this workload. TradingView’s standard library does not include a native order book depth component. Highcharts Stock and DXcharts require significant custom work to approximate this visualization at acceptable update rates.
Scenario 4: Volatility surface and 3D financial charts
Options traders, risk desks, and quant teams visualizing implied volatility surfaces, 3D correlation matrices, or three-dimensional portfolio scatter need GPU-accelerated 3D rendering that updates in real time as market data changes. LightningChart Trader provides this through its 3D surface, 3D scatter, 3D bar, and 3D line series. No other library in this comparison provides equivalent financial 3D chart types. This requirement alone narrows the decision to a single option.
6. Licensing and Cost Analysis
TradingView Advanced Charts: what the license actually covers
TradingView’s commercial charting libraries are not available to individuals, hobbyists, or for testing purposes. They are licensed to companies for web-based public products only. Watermark removal is a separate enterprise negotiation. Per-user or monthly active user pricing at scale is contract-based with no published rate card. Teams that have scaled past certain user thresholds frequently find costs have grown significantly beyond initial estimates. The bar count ceiling, the watermark policy, and the pricing opacity are collectively the main reasons teams look elsewhere.
LightningChart Trader: three published tiers
LightningChart Trader is available in three transparent license tiers. Basic covers the core financial charting engine with indicators, drawing tools, and full customization. Plus adds DataGrid, heatmaps, symbol comparison, additional chart types, and more pane layout options. Ultimate adds the complete versatile chart suite including the 3D chart library, GeoMaps, real-time scrolling charts, and the full catalog of non-financial chart types that can be composed with financial charts in the same application.
The LC Trader logo appears by default and is removable on paid plans, giving you a clean path to full white-label without any enterprise negotiation. No per-user fees for standard commercial deployments. A 30-day free trial includes the complete feature set so you can test against real production data and real production requirements before making any decision. This is what confident software looks like.
Highcharts Stock licensing
Commercial per-developer licensing with a separate Highmaps product if you need geographic components. No watermark on commercial license. SVG rendering ceiling applies regardless of license tier. A predictable cost model for teams that can accept the data volume constraints.
DXcharts
DXcharts Lite is open source. DXcharts Pro is commercial. The open source version carries the branding of Devexperts. Canvas-based rendering ceiling applies at scale. Best evaluated by teams already in the Devexperts ecosystem.
7. Which Library Wins by Use Case
Building a multi-asset institutional trading terminal
Building a crypto exchange charting UI
Building a quant research or backtesting visualization tool
Building a Python-based trading analytics or research tool
Building a risk management or options analytics platform
Building a retail broker platform with brand recognition considerations
Building a financial news site with simple price embeds
Building a financial dashboard inside a React application
8. Migrating from TradingView to LightningChart Trader
LightningChart Trader is an SDK with full API access, not a drop-in widget replacement. This means migration involves connecting your data to the chart’s API and configuring the features you need, which gives you complete control over the result.
The core financial chart types map directly. Candlestick, OHLC, Heikin-Ashi, Renko, Kagi, and Point and Figure are all available by name. Technical indicators are applied as an indicator layer on top of the price series. Drawing tools including Fibonacci retracements, trend lines, channels, and Andrews Pitchfork are in the drawing tool panel.
The main conceptual difference is in data binding. TradingView Advanced Charts uses a Datafeed API where the library calls your server to request data for specific time ranges. LightningChart Trader takes data as an array you push to the series directly. This gives you more flexibility over how data arrives but means you manage the loading logic yourself rather than implementing a server-side datafeed interface.
For most teams, migration from TradingView Advanced Charts to LightningChart Trader is a two-to-three day effort for a developer familiar with both documentation sets. The LightningChart Trader documentation covers the complete API with working code examples. The interactive examples page has live, editable code for every chart type and feature in the library.
9. Frequently Asked Questions
What is the best TradingView charting library alternative for developers in 2026?
LightningChart Trader is the strongest alternative across every performance-critical, feature-rich, or platform-diverse use case. GPU-accelerated via WebGL, no candle count ceiling, offering logo removal on paid plans with no enterprise negotiation required, available in JavaScript, Python, and .NET, and includes 100 plus indicators, 33 drawing tools, DataGrid, GeoMaps, and the only full 3D financial chart suite available in the market.
How many candles can TradingView Charting Library display?
TradingView Advanced Charts is limited to approximately 4,000 bars per chart. On a 1-minute chart, that is less than three days of data. LightningChart Trader has no practical bar ceiling and renders years of 1-minute historical data smoothly because its WebGL GPU engine processes data on the graphics card rather than the CPU.
Does TradingView charting library require a watermark?
Yes. TradingView Advanced Charts and Trading Platform both require a TradingView watermark unless enterprise removal is negotiated separately. Lightweight Charts also requires logo attribution under its Apache 2.0 license. LightningChart Trader shows a small LC Trader logo by default, which is removable on paid plans through a simple and transparent process. No enterprise negotiation required.
Does LightningChart Trader support 3D financial charts?
Yes, and it is the only major financial charting library that does. The 3D suite includes 3D surface charts for volatility surfaces and terrain mapping, 3D scatter for multi-dimensional portfolio and risk visualization, 3D bar charts, 3D line series, and 3D mesh models. All GPU-accelerated and capable of real-time updates as market data changes.
Does LightningChart Trader have a Python version?
Yes. LightningChart Python Trader is a dedicated financial charting library for Python. It uses the same WebGL GPU rendering engine as LightningChart Trader and includes 100 plus technical indicators, 30 plus drawing tools, and the full set of financial chart types including candlestick, OHLC, Heikin-Ashi, Renko, Kagi, and Point and Figure. It integrates natively with NumPy and Pandas, which makes it the natural tool for quant research notebooks, backtesting visualization, algo trading analytics, and Python-based financial dashboard work. A 7-day free trial is available at lightningchart.com/python-charts/trader/. No other financial charting library in this comparison has a Python product.
How does LightningChart Trader compare to Highcharts Stock?
Highcharts Stock is a capable library for standard financial dashboards with moderate data volumes. It uses SVG rendering, which works well up to tens of thousands of data points. At higher volumes, real-time update rates above a few dozen per second, or any 3D requirement, Highcharts Stock reaches its ceiling. LightningChart Trader covers all of those scenarios because its GPU rendering engine is not subject to the same constraints. For straightforward stock price charts with modest data, Highcharts Stock is a reasonable choice. For anything beyond that, LightningChart Trader is the upgrade.
Is there a free trial for LightningChart Trader?
Yes. The 30-day free trial includes the complete feature set across all three tiers, no payment details required. You can test against your real production data and your real production requirements before any purchasing decision. Start at lightningchart.com/js-charts/trader/.
Can I use LightningChart Trader as a replacement for TradingView’s charting library?
Yes. LightningChart Trader covers all the core financial chart types in TradingView Advanced Charts, plus more. The migration takes a few days for a developer familiar with both documentation sets. The result is a charting layer that is faster, more customizable, free of forced third-party branding (logo removable on paid plans), and not subject to the bar count or watermark constraints that made TradingView Advanced Charts limiting in the first place.
Try LightningChart Trader free for 30 days. Full feature set, no credit card required.
Start 30-day free trial ·
Browse interactive examples ·
Read documentation
Related reading:
Continue learning with LightningChart
The LightningChart JS Agent Skill: Give Any AI Coding Agent Accurate Charting Knowledge in 60 Seconds
An agent skill is a folder of instructions your AI coding tool picks up automatically. This one teaches any compatible agent how to use LightningChart JS correctly, before it writes a single line of chart code. Agent skills are a relatively new concept and the...
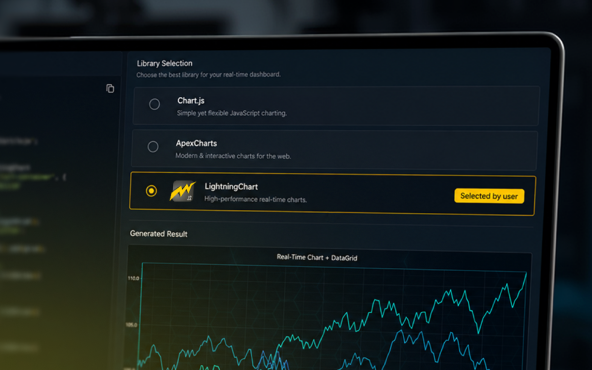
Why AI Coding Agents Get Data Visualization Wrong, and What to Do About It
AI coding assistants are getting good at most parts of application development. Data visualization is one of the areas where they still have a consistent, predictable failure mode. This article explains the mechanics of why it happens and the practical fix. I spent a...
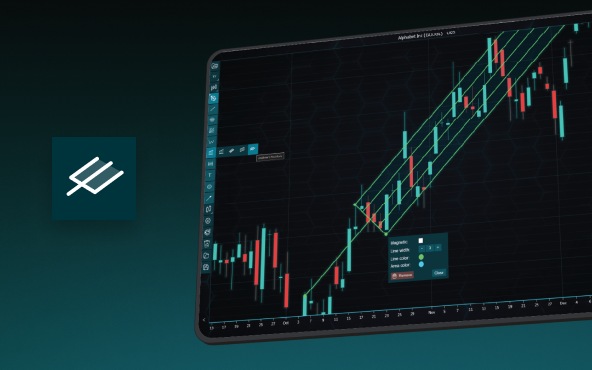
Andrews’ Pitchfork in Technical Analysis
Andrews' Pitchfork is one of the most respected technical analysis tools used by traders to identify potential support and resistance levels, trend direction, and future price paths. Developed by Dr. Alan H. Andrews, the indicator is based on the principle that prices...



If you have any questions, feel free to contact us!



©LightningChart Ltd 2026. All rights reserved.