


LightningChart JSCreate an interactive Angular Bubble Chart App
TutorialEasily get started with Angular and Bubble Charts using LightningChart JS.
Written by a human | Updated on April 11th, 2025
Angular Bubble Chart App
Hello there, in this tutorial, we’ll use Visual Studio Code and typescript to build a brand-new Angular template from scratch. Also, we’ll modify a bubble chart’s characteristics to fit the Angular structure using the LightningCharts JS module.
You’ll learn how you can use commands to start an angular project at the end of this tutorial.
What is Angular as a framework?
An effective and well-liked front-end development framework is Angular, which is used to build interactive and dynamic online apps. It was initially conceived by Google in 2010, and since then, it has undergone a number of significant changes to become one of the most used frameworks in the sector.
With the aid of Angular, software developers may create single-page applications (SPAs) by combining HTML, CSS, and TypeScript, a superset of JavaScript that offers more features and advantages for complex projects. With its extensive toolkit and feature set, Angular streamlines the development process and empowers programmers to build engaging and responsive online applications.

Project Overview
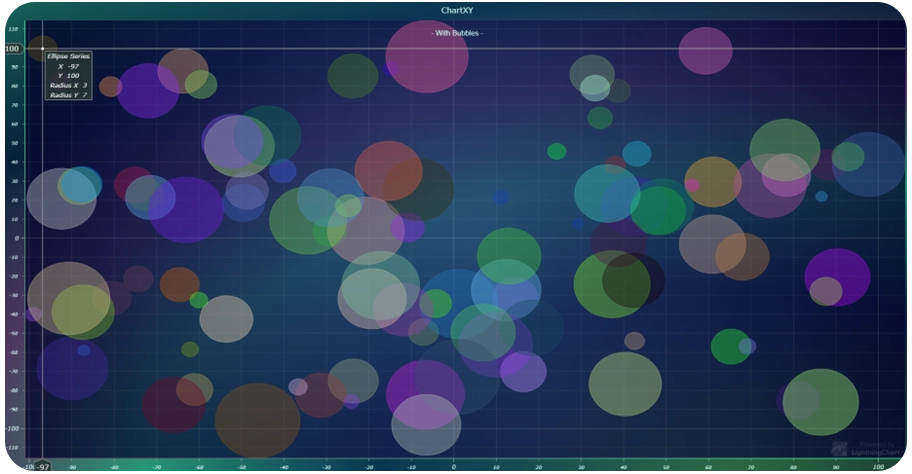
A bubble chart is a style of data visualization that uses a collection of circles, or “bubbles,” to show three dimensions of data. Each bubble’s location on the graph corresponds to its values for two dimensions, often the x-axis and y-axis. The size of each bubble serves as a representation of the third dimension.
A bubble chart, for instance, could illustrate the connection between a company’s revenue, profit, and market share. The size of each bubble may indicate the market share of the company, with the x-axis maybe representing revenue, and the y-axis possibly representing profit.
Bubble charts are a common choice among data analysts and business professionals because they can be used to display complex data in a way that is both understandable and clear. Bubble charts can effectively convey data insights and create a compelling tale when they are designed properly.
 Download the project to follow the tutorial
Template Setup
1. Create a new empty folder.
2. Open Visual Studio Code and open your new folder:
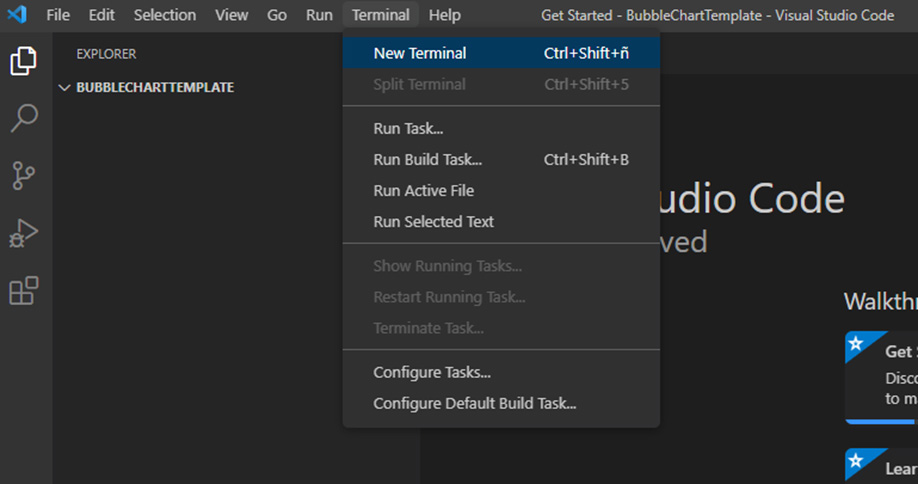
3. Open a new terminal end execute the following command:
npm install -g @angular/cliThis command will download and install Angular on your pc.
4. Creating the Angular project:
ng new bubble-chartThe [ng new] command indicates that you want to create a new Angular project, inside the path where your terminal is pointing. The [bubble-chart] property is the name of the project. You can specify the name you want.
The [ng new] command indicates that you want to create a new Angular project, inside the path where your terminal is pointing.
The [bubble-chart] property is the name of the project. You can specify the name you want.
5. Angular routing?
? Would you like to add Angular routing? (y/N) nThe routing enables navigation between views. We don’t need to use routing for this example so we will type “n” as a response. If you need an example for routing, you can visit the article Ionic Capacitor Charting App with Angular and JS Charts
6. Stylesheet format?
? Which stylesheet format would you like to use? (Use arrow keys)
> CSS
SCSS	[https://sass-lang.com/documentation/syntax#scss]
Sass	[https://sass-lang.com/documentation/syntax#the-indented-syntax]
Less 	[http://lesscss.org]
You will have to select between the options listed above. Depending on your experience with those formats, you can choose the one that fits you the best. In this case, we won’t use complex style classes, so I selected [CSS]. If the Angular project was created successfully, you will see a result like this:
CREATE bubble-chart/src/app/app.component.spec.ts (974 bytes)
CREATE bubble-chart/src/app/app.component.ts (216 bytes)
CREATE bubble-chart/src/app/app.component.css (0 bytes)
✓ Packages installed successfully.
"git" is not recognized as an internal or external command, program, or executable batch file.
PS C:\LightningCharts\Charts\BubbleChartTemplate>
If you go to the project folder, you will see the new files:
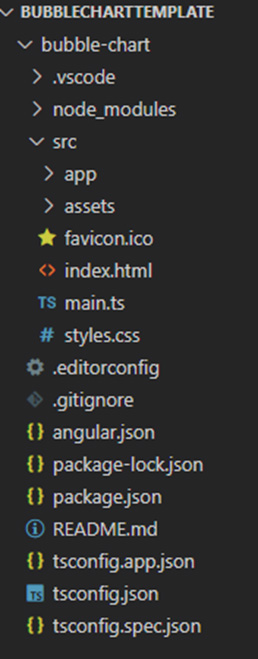
- The node_modules folder contains all dependencies installed by Angular.
- The source (src) folder, contains the files for our code.
- The app folder contains the default component files.
- A component definition can be simplified, as the group of files (TS, CSS, and HTML) that construct a view for our application.
Now we can start to work with our LightningCharts.
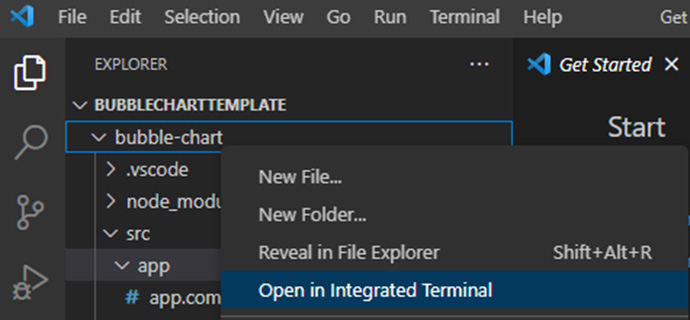
7. Open a new terminal above the Angular project folder:
8. Execute the following command:
npm i @arction/lcjsThe @Arction/lcjs library will help us to create many charts from the LightningChart catalog. At this point, we already have our Angular project ready to be used with LightningChart JS. Now, let’s code!
Creating the Chart
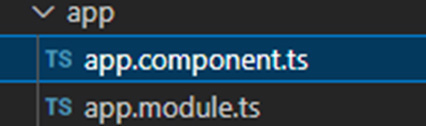
By default, Angular will create the following files:

If you run the command [ng serve], you will be able to see a default website.

For this exercise, we don’t need the default template, so we can delete the CSS, HTML and spec files:
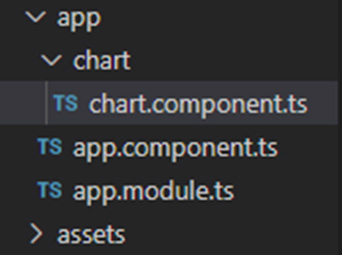
We will use the component and module files, as a main panel where we will show our chart. Please, create a new folder (I named this folder “chart”), and create a component TS file:
1. app.component.ts
import { Component } from '@angular/core';
@Component ({
	selector: 'app-root',
	templateUrl: './app.component.html',
	styleUrls: ['./app.component.css]
})
export class AppComponent {
	title = 'bubble-chart';
}
The component file is the main building block. Here we can specify the HTML and CSS templates to be rendered.
- The component decorator allows us to use Angular classes as components.
- The selector decorator identifies the directive in the template.
- styleUrls contains the path to our CSS stylesheet.
- templateURL contains the path to our HTML template.
- The AppComponent class will contain all the functions and properties (such as the title) that will be used to create our view.
For this example, we don’t need an entire HTML template. You can create it if you want to practice with more HTML elements but in this case, we will create a basic HTML block. As the title is not necessary, we can delete it.
template: `
  <div>
    <app-chart></app-chart>
  </div>`,
  styles: ['div { height: 100vh }']
2. chart.component.ts
In this component, we will create our chart. First, we need to import all the classes required to construct our chart. The way to import our classes in Angular is a little bit different from a normal JavaScript project. See how:
import { Component, Input, AfterViewInit, OnChanges, OnDestroy } from '@angular/core';
import {    lightningChart,
            ChartXY,
            Point,
            ColorRGBA,
            FontSettings,
            Themes,
            UIOrigins,
            UIDraggingModes,
            emptyFill,
            emptyLine,
            SolidFill,
            SolidLine,
            Animator,
            AnimationEasings
        } from '@arction/lcjs';
3. HTML object location
We need to specify the HTML object where our component we will be rendered:
@Component({
  selector: 'app-chart',
  template: '<div [id]="this.chartId"></div>',
  styles: ['div { height: 100% }']
})
The [app-chart] element was declared in the HTML template of the app.component.ts file. The template decorator will contain the inner HTML template for the chart component.
4. Properties
Now, we need to implement some properties:
export class ChartComponent implements OnChanges, OnDestroy, AfterViewInit {
  chart!: ChartXY;
  chartId!: number;

@Input()
	points!: Point[];

constructor() {}- The OnChanges lifecycle hook will be called when any property of a directive changes. The default definition for this hook is [ngOnChanges].
- OnDestroy is called when a directive, pipe, or directive is destroyed. We can use it for cleanup when an object is destroyed. The default definition for this hook is [ngOnDestroy].
- AfterViewInit is called when angular completed the initialization of a component view. [ngOnAfterViewInit].
5. Storing code within ngAfterViewInit
ngAfterViewInit() {

        const fonts = {
            subTitle:new FontSettings({
                size: 15,
            }),
                title: new FontSettings({
                size: 40,
                weight: 400
            })
}- Fonts: font properties that can be used by selecting a declared setting.
6. Object .ChartXY
this.chart = lightningChart()
.ChartXY({container: `${this.chartId}`, theme:Themes.auroraBorealisNew})- Chart: this object will contain the constructed chart.
- Container: the HTML element that will contain the chart.
- Theme: Look and Feel of the chart. Read more about it in the Themes documentation.
7. addUIElement
this.chart.addUIElement(undefined, this.chart.uiScale)
        .setPosition({ x: 50, y: 93 })
        .setOrigin(UIOrigins.Center)
        .setText('- With Bubbles -')
        .setTextFont(fonts.subTitle)
        .setDraggingMode(UIDraggingModes.notDraggable)
        .setBackground((bg) => bg
            .setFillStyle(emptyFill)
            .setStrokeStyle(emptyLine)
        )

        const bubbleWidthHeightRatio = {
            x: window.innerHeight / window.innerWidth,
            y: 1
}- addUIElement: a group of UI properties for the chart object. We can specify the position of the vector, subtitle, font, Dragging, and background properties.
- bubbleWidthHeightRatio: this constant will get the window height and width. Those values will be used to calculate the proportion of each bubble without exceeding the size of the window.
8. ellipseSeries
const ellipseSeries = this.chart.addEllipseSeries()
let bubbleCount = 0- addEllipseSeries: Method for adding a new EllipseSeries to the chart. This series type visualizes a collection of ellipses.
9. bubbleDragHandler
const bubbleDragHandler = (figure: { getDimensions: () => any; setDimensions: (arg0: any) => void; scale: { x: { getPixelSize: () => number; }; y: { getPixelSize: () => number; }; }; }, event: any, button: any, startLocation: any, delta: { x: number; y: number; }) => {
            const prevDimensions = figure.getDimensions()
            figure.setDimensions(Object.assign(prevDimensions, {
                x: prevDimensions.x + delta.x * figure.scale.x.getPixelSize(),
                y: prevDimensions.y + delta.y * figure.scale.y.getPixelSize()
            }))
}- bubbleDragHandler: In order to simulate the drag of each bubble, we will need to obtain the interval and the size of the pixels of the scale direction. To obtain the interval, the dimension of each axis will be obtained from the figure object and also we will sum the delta value to this result.
- Delta is a variable that will contain the central value within the chart. To adjust for interval changes, multiply the above result by the pixel size in each scaling direction.
- getPixelSize(). To get the pixel size on each axis, the getPixelSize() function must be used.
10. resizeBubble
const resizeBubble: []
const sizeArray: []- Create a resizeBubble array and sizeArray to store the values separately.
11. addBubble
const addBubble = (pos: { x: any; y: any; }, size: number) => {
            const radius = size * 2.5

            var num = Math.round(0xffffff * Math.random());
            var r = num >> 16;
            var g = num >> 8 & 255;
            var b = num & 255;

            const fillStyle = new SolidFill({ color: ColorRGBA( r, g, b, 95 ) });
            const strokeStyle = new SolidLine({  fillStyle: new SolidFill({ color: ColorRGBA( r, g, b, 95 ) }), thickness: 1 })

            const figure = ellipseSeries.add({
                x: pos.x,
                y: pos.y,
                radiusX: radius * bubbleWidthHeightRatio.x,
                radiusY: radius * bubbleWidthHeightRatio.y
            })
                .setFillStyle(fillStyle)
                .setStrokeStyle(strokeStyle)

            // Make draggable by mouse.
            figure.onMouseDrag(bubbleDragHandler)
            bubbleCount++
            return figure
}- The addBubble function will create the bubbles by collecting values from all previous constants and functions that we worked on before.
- The pos(position) and size parameters, will be provided when this function is executed.
- The Radius constant is equal to the size value. The multiplication works as a ratio increaser, you can increase or decrease it by removing or modifying the value of this.
- To assign the color of the bubbles and their borders, we will use random numbers for the red, green, and blue RGB colors. The 95 value is the transparency value.
- The figure object will execute the function addEllipseSeries, this function is provided by the LC library, and it creates ellipses figures for an XY chart.
- Inside the figure constant, we will encapsulate the position and radius properties for each bubble.
12. Drag Handler
Finally, the UI properties and the Drag handler function will be added to the bubble. The addBubble function will be executed by the addRandomBubble. This function will create a random position and size values. If you want to use real data from a JSON object or database, you can modify this function.
const addRandomBubble = () => {
            const pos = {
                x: Math.random() * 200 - 100,
                y: Math.random() * 200 - 100
            }
            const size = 1 + Math.random() * 7.0
            sizeArray.push(size)
            resizeBubble.push(addBubble(pos, size))
        }
13. Animator
const bubbleMaxCount = 100

        // Animate bubbles creation.
        Animator(() => undefined)(2.5 * 1000, AnimationEasings.ease)([[0, bubbleMaxCount]], ([nextBubbleCount]) => {
            while (bubbleCount < nextBubbleCount)
                addRandomBubble()
        })
To finish with the code, we will need to execute the Animator function from the LC library. The AnimationEasings collector will help us to work with some values for the animation process. Read more in the AnimatorEasings documentation.
The multiplication values will affect the display speed of each bubble. bubbleMaxCount will be the limit of how many bubbles we could create on the chart. As long as nextBubbleCount is less than bubbleCount, a new bubble will be created.
Final Application

In conclusion, using Angular to create bubble charts can be a practical and visually appealing method of displaying data in web apps. You can create interactive and scalable bubble charts with Angular by utilizing well-known charting tools like LightningChart JS, which is available under a free community license.
The x-axis, y-axis, and bubble size are three dimensions of data that are effectively displayed by bubble charts. They are frequently used to demonstrate connections between data points and to draw attention to outliers. Angular is a wonderful choice for producing data visualizations because it offers a versatile framework for creating dynamic and responsive online applications.
Choosing a charting library, importing it into your project, and configuring the chart to display your data are the steps required to create a bubble chart with Angular. To improve the user experience, LightningChart JS also lets you include elements like tooltips, legends, and animations.
You may make a captivating and instructive bubble chart that aids users in comprehending complex data sets by adhering to best practices for data visualization and user interface design.
In summary, creating bubble charts with Angular can be a valuable tool for developers who want to present data in a clear and engaging way within high-performance applications capable to render million and billion of data points without compromising UI features.

Omar Urbano
Software Engineer
Continue learning with LightningChart

React Charting Performance
Here's a scenario that plays out across development teams every few months. Someone builds a React dashboard, picks Recharts or Victory because they're popular, the devs love them, and the first demo looks great. Then the dataset gets bigger. Or the data starts...

Javascript Charting Library comparison 2026
Every year someone publishes a listicle of JavaScript charting libraries. They screenshot a demo, note the GitHub stars, paste in the npm install command, and call it a day. Then you follow their recommendation, get six months into your project, and discover that your...

Visualizing 10 Million Data Points in the Browser (2026): The Technical Deep-Dive
Ten Million Data Points in the Browser: How WebGL Makes Mass Datasets Interactive Ten million data points. That number used to mean a database problem, not a front-end problem. Now research teams want to explore it interactively in a browser. Trading desks want...


If you have any questions, feel free to contact us!
©LightningChart Ltd 2026. All rights reserved.