




Andrews' Pitchfork in Technical Analysis
Article
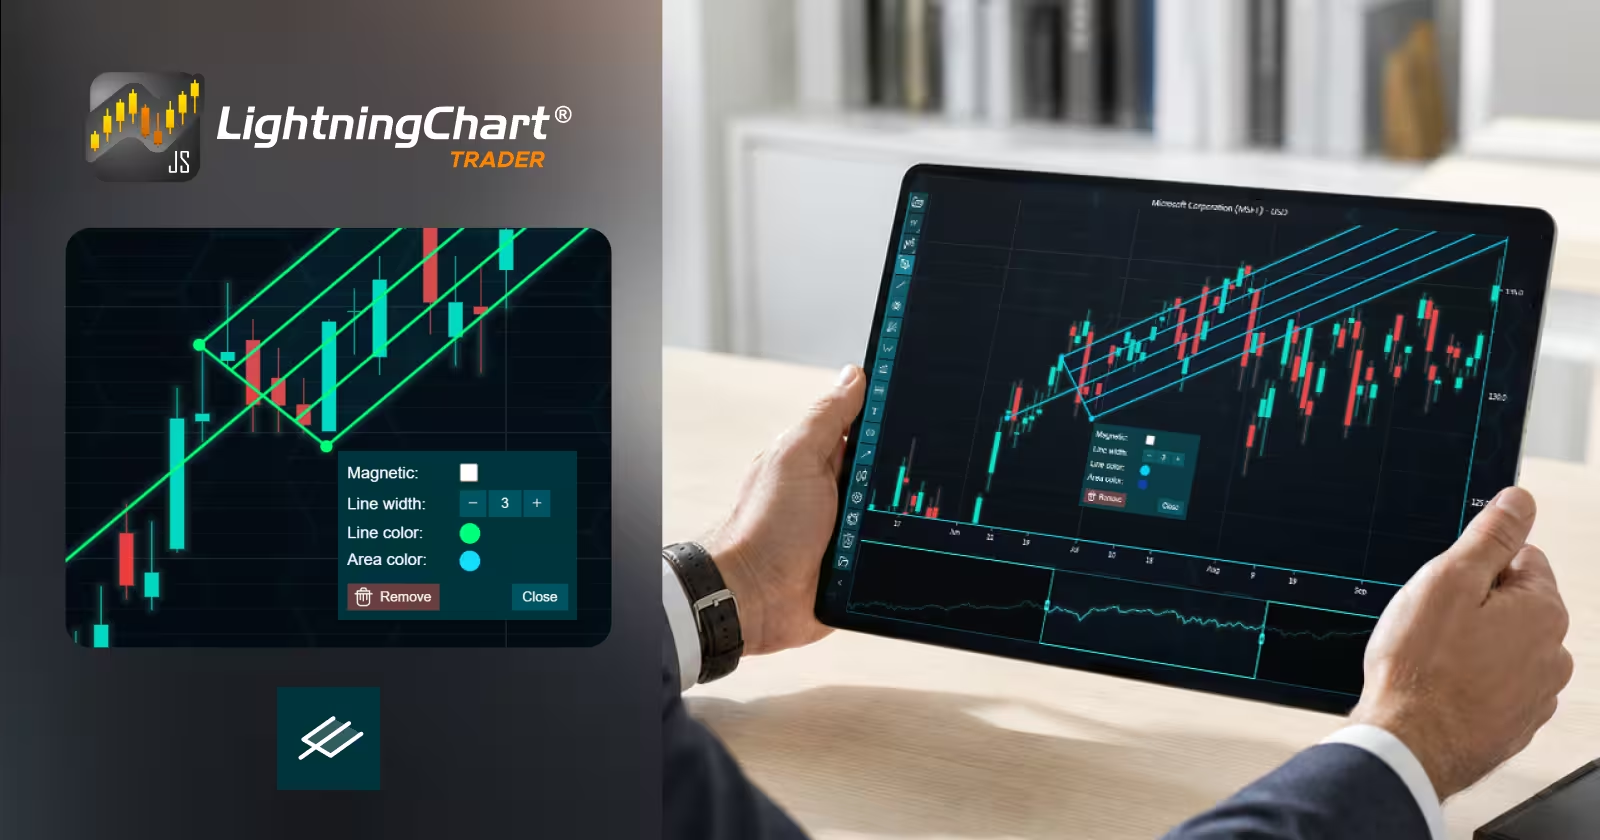
Andrews’ Pitchfork is one of the most respected technical analysis tools used by traders to identify potential support and resistance levels, trend direction, and future price paths. Developed by Dr. Alan H. Andrews, the indicator is based on the principle that prices tend to gravitate toward a median line while oscillating within parallel trend channels.
Unlike traditional trendlines, Andrews’ Pitchfork provides a structured framework for analyzing market movement, making it popular among forex, stock, cryptocurrency, and futures traders.
In this article, we’ll explore what Andrews’ Pitchfork is, how it works, benefits of using it as well as its disadvantages, and finally how traders can incorporate it into modern trading strategies. We also take a look how to use the Pitchfork in one of the technical analysis platforms available, LightningChart JS Trader.
What Is Andrews’ Pitchfork?
Andrews’ Pitchfork is a charting tool constructed from three significant price points:
- Point A: A major swing high or swing low.
- Point B: The next significant swing in the opposite direction.
- Point C: The following swing that confirms the developing trend.
Using these three points, the indicator automatically draws a median line from point A to the right edge of the chart, running through the middle point between points B and C. Upper and lower lines are then drawn from points B and C, running parallel with the median line. Some technical analysis platforms also draw additional lines between the parallel lines and the median line. The resulting shape resembles a farming pitchfork, which gives the tool its name.
Most trading platforms, like LightningChart JS Trader, provide Andrews’ Pitchfork as a built-in drawing tool.
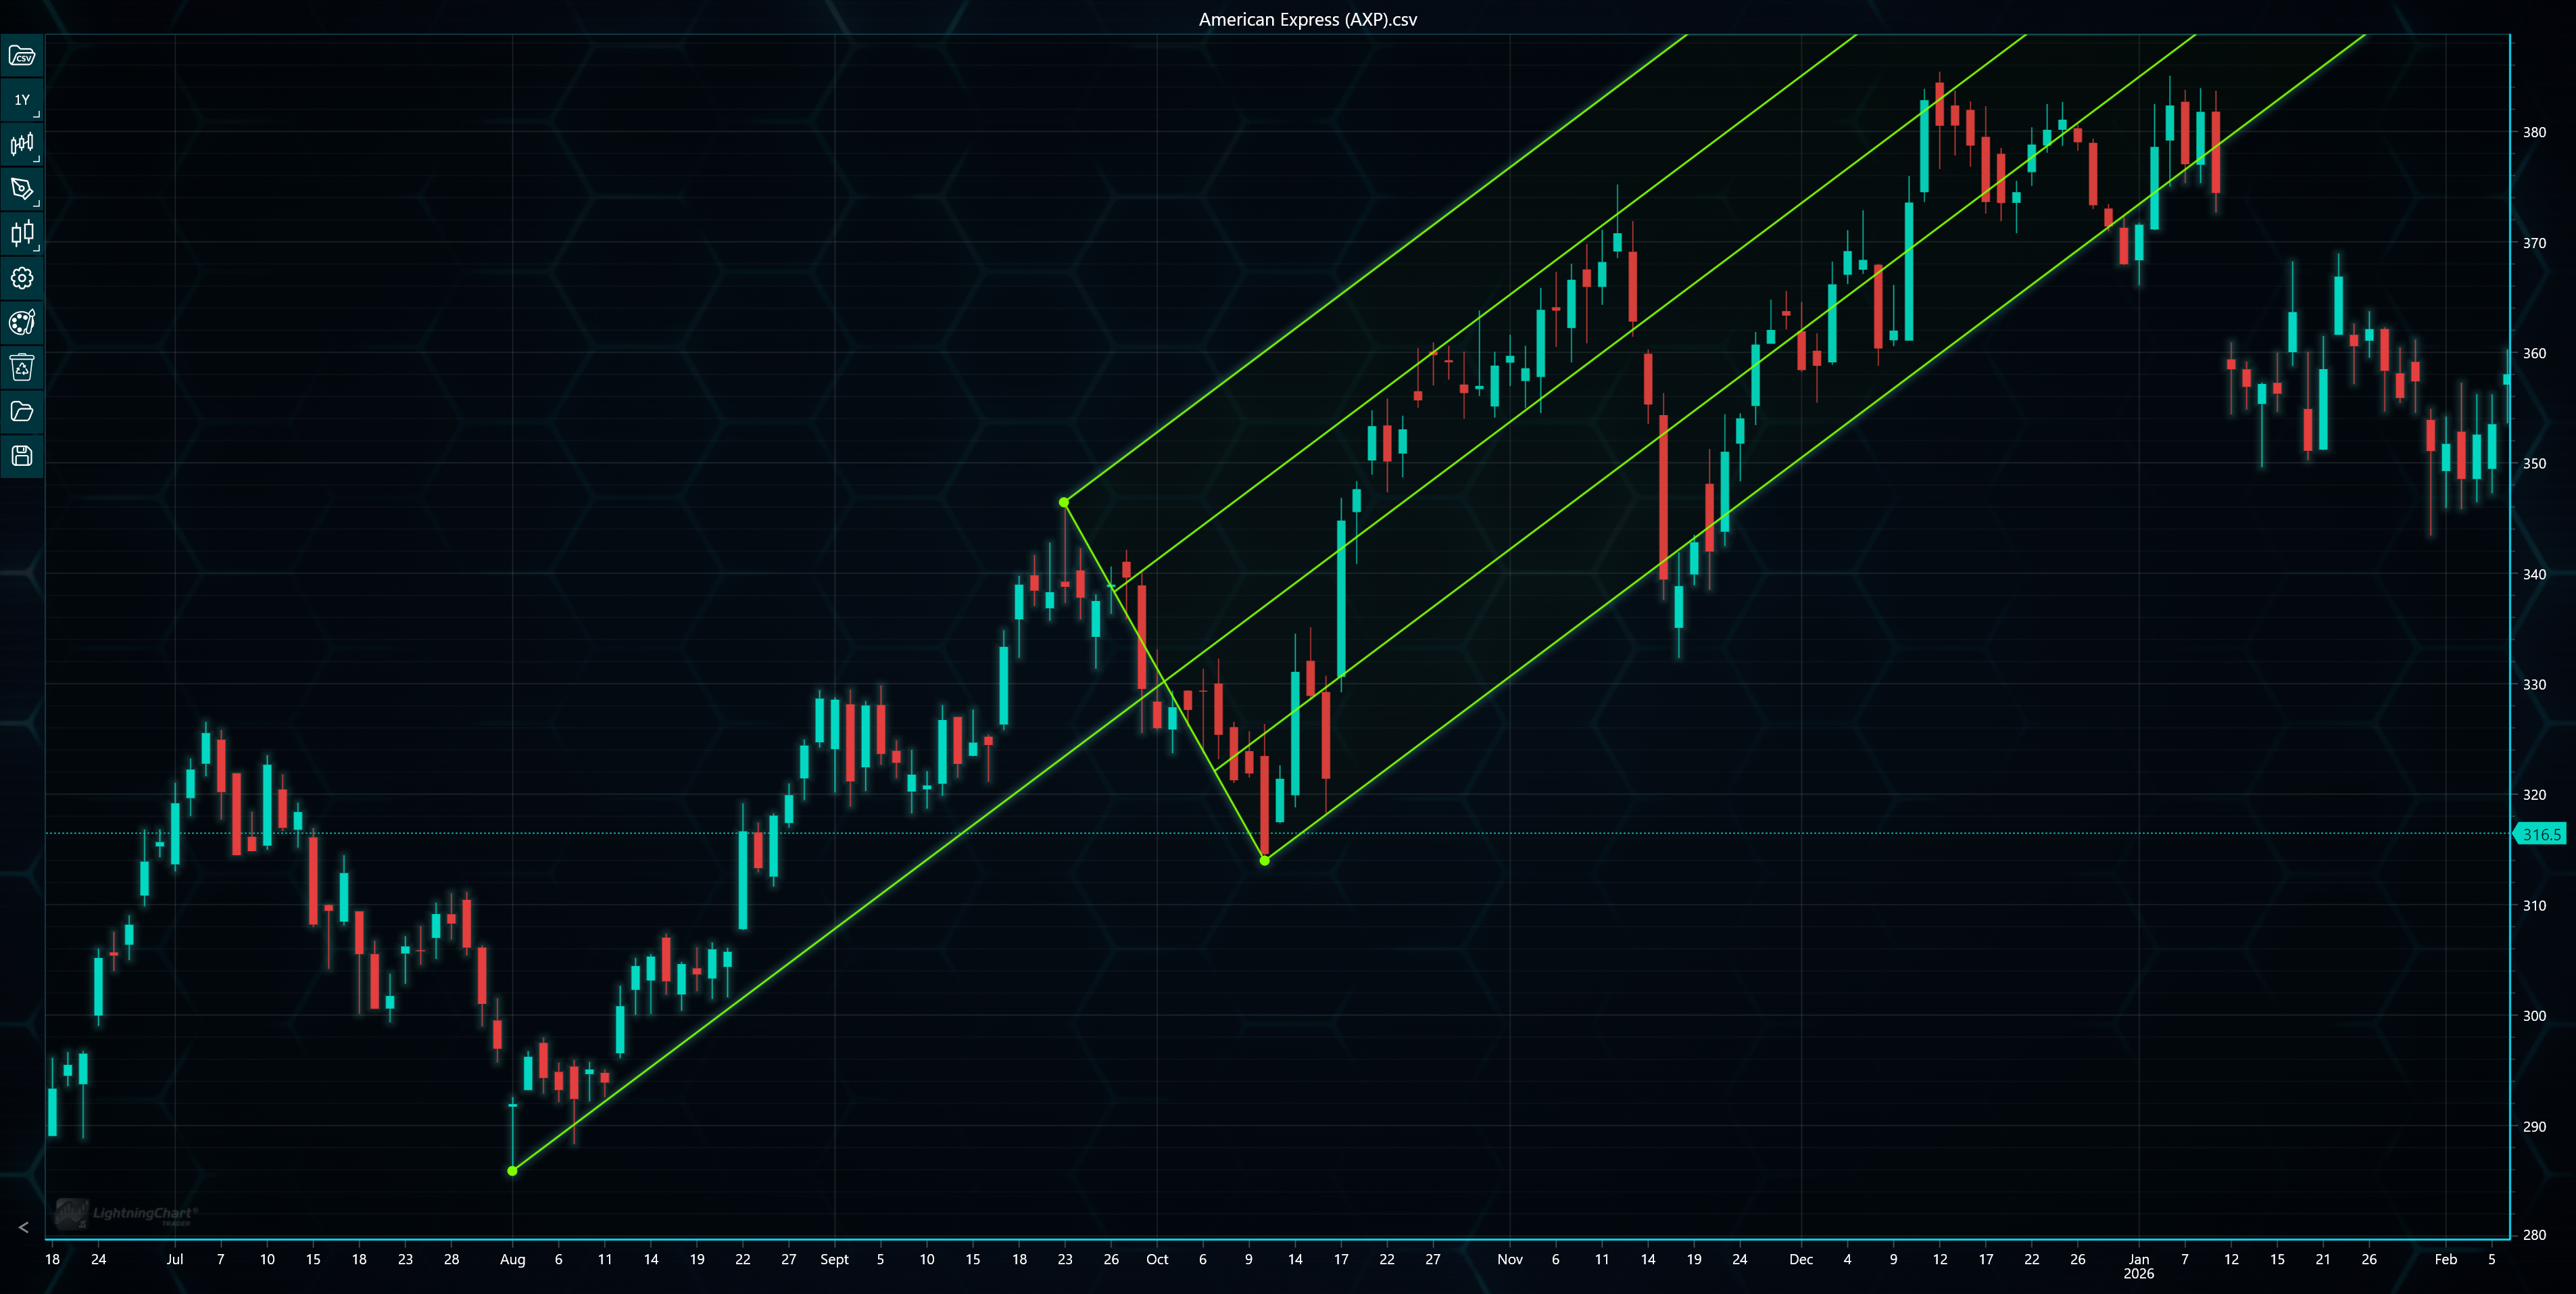
Andrews’ Pitchfork in LightningChart JS Trader. Point A is placed at a major swing location, point B in the next significant swing position, and point C in the location of the trend confirming swing.
How Andrews’ Pitchfork Works
The core idea behind Andrews’ Pitchfork is the Median Line Principle:
Prices have a tendency to move toward the median line after significant market swings.
This means the median line acts as a magnetic center for price action, while the upper and lower lines often function as dynamic support and resistance levels. As prices fluctuate, traders observe how they interact with these three lines to anticipate reversals, continuations, or breakouts.
Interpreting the Pitchfork depends on the latest price behavior. If the price moves toward the median line after the pitchfork is drawn, it often indicates the trend remains healthy. A successful touch followed by continuation can be used to confirm the strength of the trend.
When the price reaches the upper parallel line, it means resistance may develop, leading to buyers taking profits. This does not necessarily indicate a reversal but highlights an area where momentum may slow and short-term pullbacks become more likely.
Respectively, the lower parallel often behaves as dynamic support. Bullish traders watch this region for bounce opportunities. However, it is wise to seek confirmation from other indicators, since if the price starts to fall below the lower line, it could also indicate another swing in the trend.
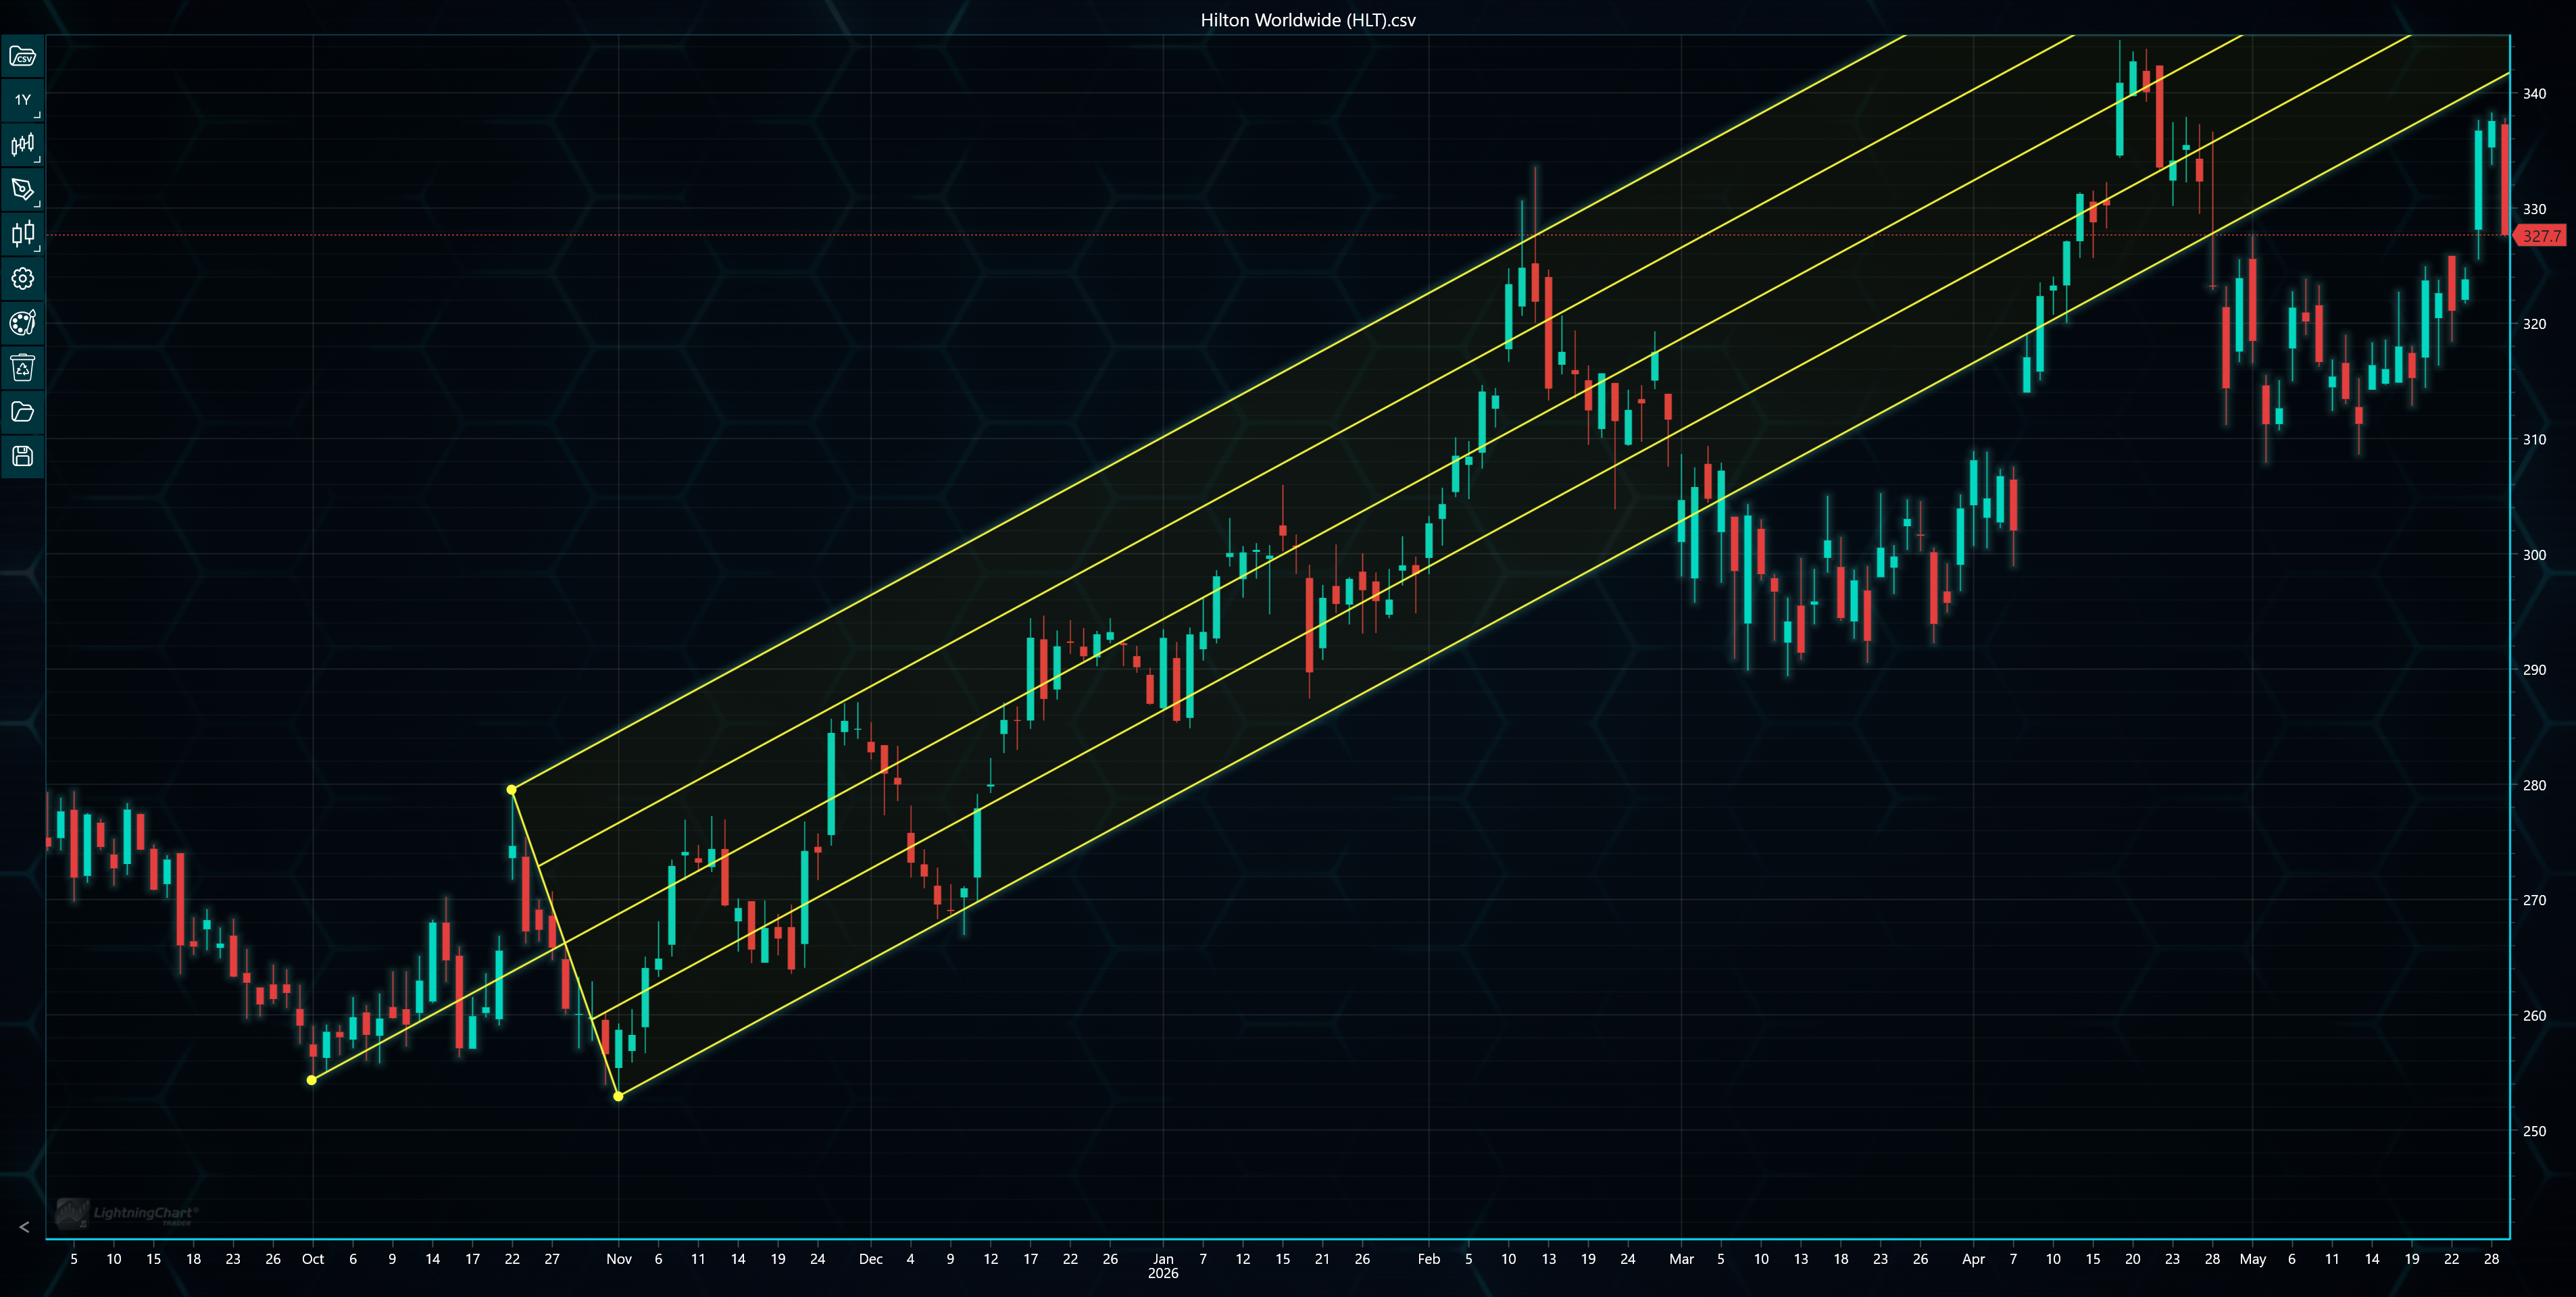
Andrews’ Pitchfork, where the price dances around the median line. When the price reaches lower regions of the Pitchfork, it quickly bounces back towards the median line. Respectively, reaching the upper parallel line marks a potential selling point and starts a momentary reversal.
Trading Strategies Using Andrews’ Pitchfork
There are several trading strategies involving Andrews’ Pitchfork, depending on what line the price is heading towards.
- Median Line Strategy
One of the simplest approaches is trading toward the median line. For example, after identifying the three swing points and drawing the pitchfork, wait for price to move away from the median. Then enter in the direction of the expected return toward the median line. This strategy is based on the assumption that prices frequently revisit the center of the trend.
- Parallel Bounce Strategy
Many traders look for entries when price touches upper or lower parallel boundaries. In an uptrend, buy near the lower parallel and target the median line or upper parallel. Respectively, in a downtrend, sell near the upper parallel while targeting the median line or lower parallel. Confirmation from candlestick patterns can improve reliability.
- Breakout Strategy
Occasionally, price breaks beyond the upper or lower parallel. Strong breakouts accompanied by high volume may signal trend acceleration and market imbalance, but also new trading opportunities. If the breakout happens in the opposite direction of the current trend, a reversal is likely. In a downtrend, a breakout above the upper line is a buy signal while a breakout below the lower line in an uptrend is a sell signal. However, false breakouts are common, so confirmation is important before entering a trade.
Combining Andrews’ Pitchfork with Other Indicators
Andrews’ Pitchfork is often most effective when used alongside other forms of analysis. Popular combinations include:
- Relative Strength Index (RSI) for momentum confirmation.
- Moving averages to identify the primary trend.
- Fibonacci retracement levels for confluence.
- MACD to confirm momentum shifts.
- Volume analysis to validate breakouts.
Using multiple tools can reduce false signals and improve confidence in trading decisions.
Benefits
Andrews’ Pitchfork offers several benefits including clearly identifying the current trend direction and providing dynamic support and resistance levels. It also helps estimate potential price targets.
Another advantage of the Pitchfork is that it works across multiple timeframes makes it useful for both day traders and long-term investors. Furthermore, it can be applied to stocks, forex, cryptocurrencies, commodities, and indices.
Limitations
Despite its usefulness, Andrews’ Pitchfork has also some drawbacks. First, the quality of the analysis depends heavily on selecting the correct swing points. Different traders may choose different anchor points, resulting in different pitchforks.
Additionally, the Pitchfork performs best in trending markets, while in side-way markets and highly volatile conditions its effectiveness decreases significantly as misleading signals become more common.
In the end, the Pitchfork should be combined with other indicators and not be used as a standalone trading system.
Risk Management
No technical indicator guarantees profitable trades, and Andrews’ Pitchfork is not an exception to this. Therefore, it is important to follow a couple of guidelines to minimize potential loss.
When using Andrews’ Pitchfork:
- Always define a stop-loss before entering a position.
- Risk only a small percentage of your trading capital per trade.
- Wait for confirmation rather than trading every touch of a pitchfork line.
- Avoid forcing a pitchfork onto unclear market structures.
Proper risk management is essential regardless of the indicator being used.
Andrews’ Pitchfork in LightningChart JS Trader
Most trading data visualization platforms have some form of Andrews’ Pitchfork built in. In this chapter, we’ll look at one of them, LightningChart JS Trader.
LightningChart JS Trader is a high-performance financial charting solution built on the LightningChart JS platform, designed for professional trading and market analysis applications. It provides advanced interactive charts, real-time data visualization, technical indicators, drawing tools, and seamless handling of large streaming datasets. With its GPU-accelerated rendering engine, LightningChart JS Trader delivers smooth performance even with large datasets, enabling developers to build responsive, feature-rich trading platforms for web-based financial applications.
In LightningChart JS Trader, Andrews’ Pitchfork can be drawn by selecting it from the drawing tool menu and channels sub-menu found in the left toolbar. After this, the three significant price points can be positioned one-by-one by simply clicking the chart.
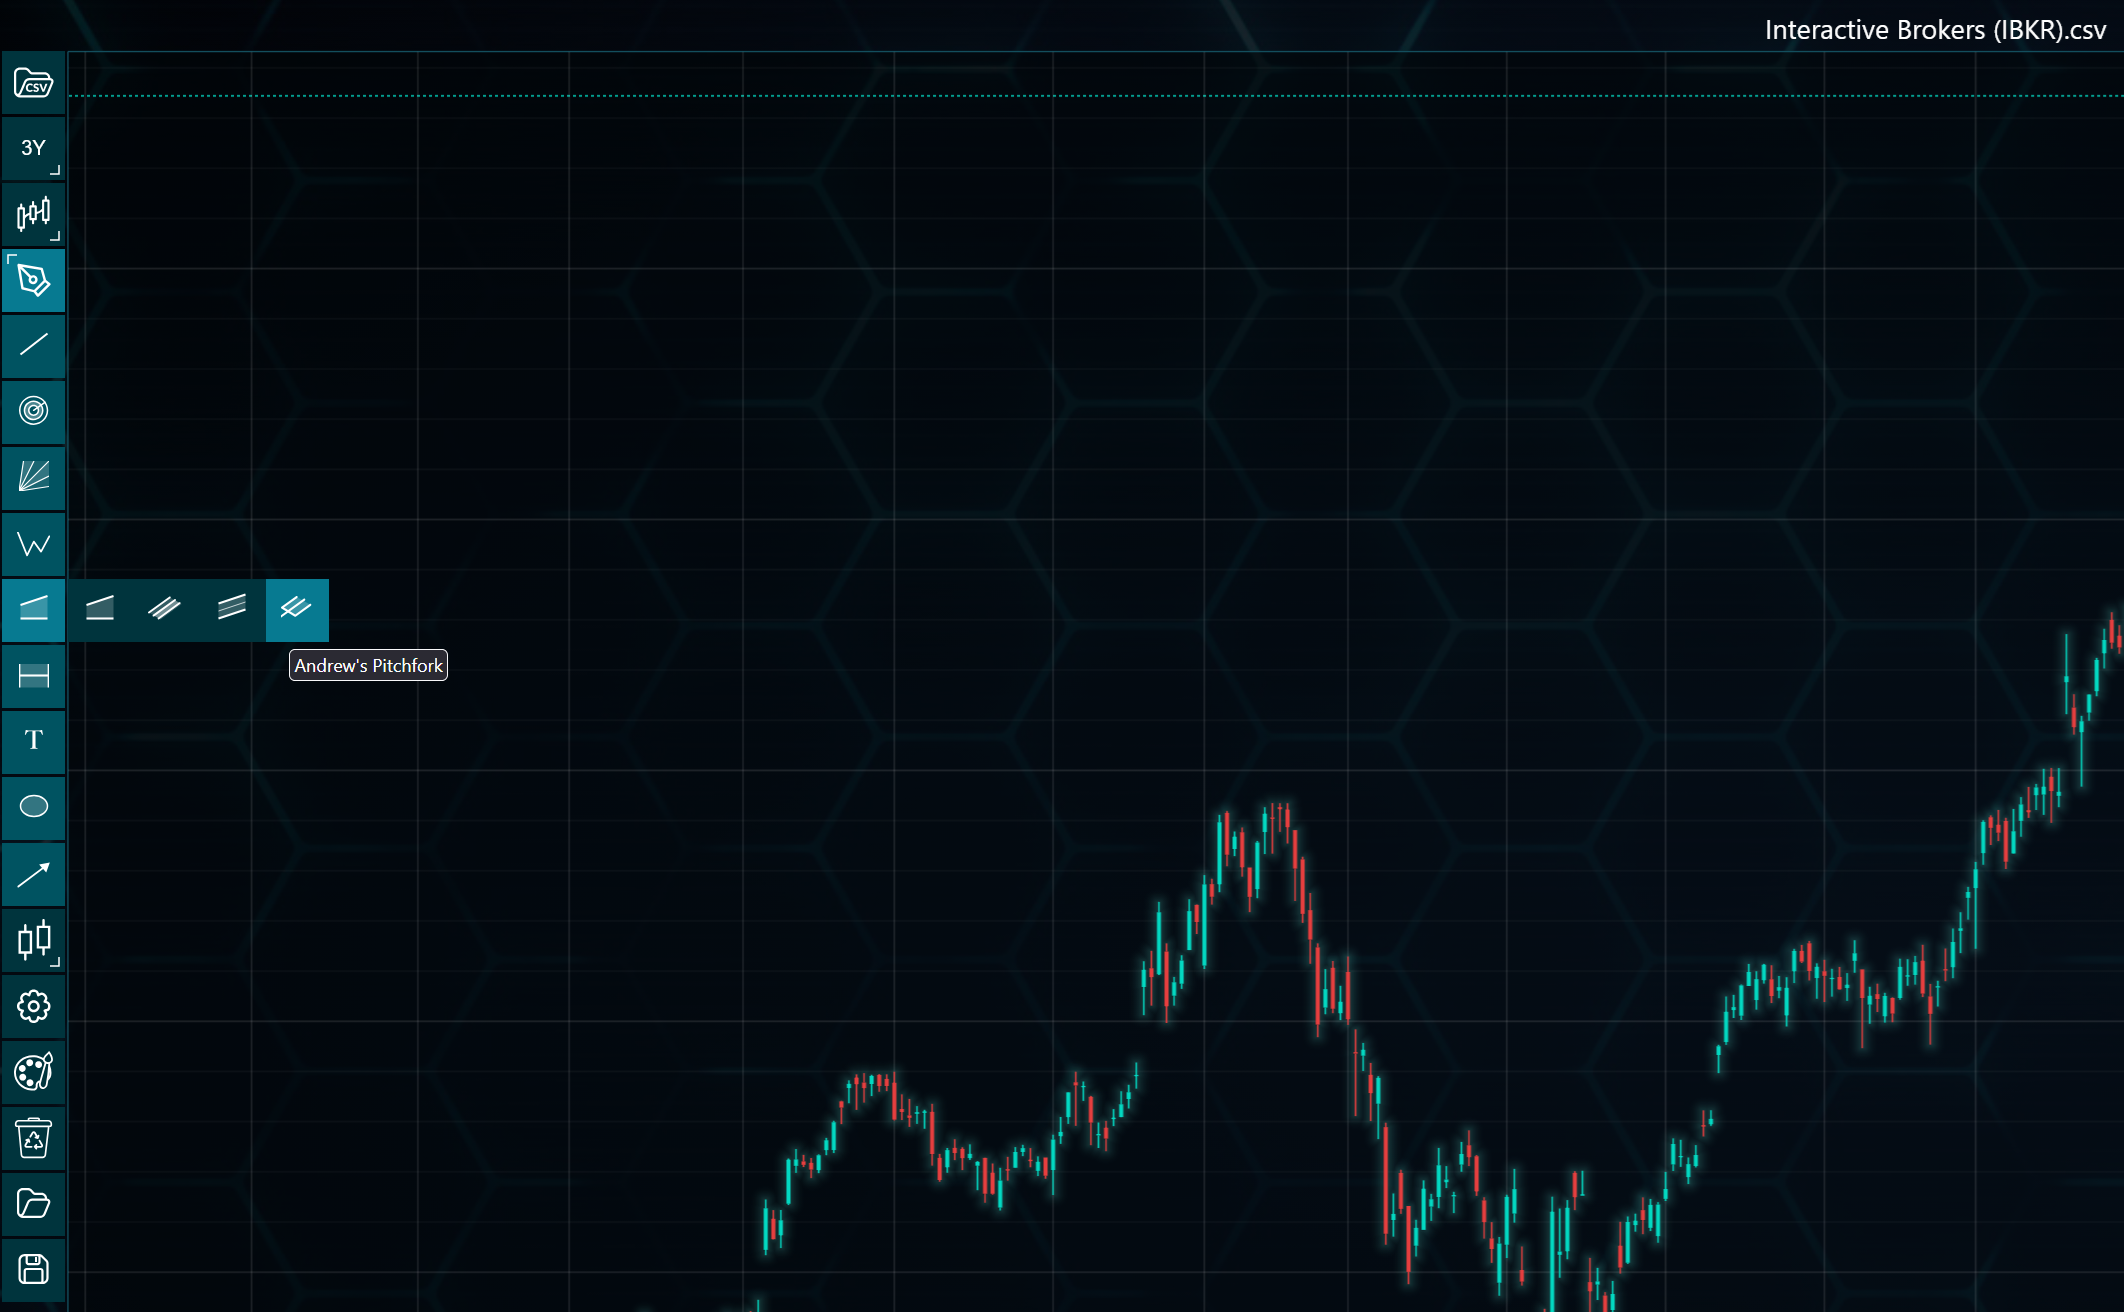
Selecting Andrews’ Pitchfork in LightningChart JS Trader. Clicking the corresponding icon will initiate the drawing.
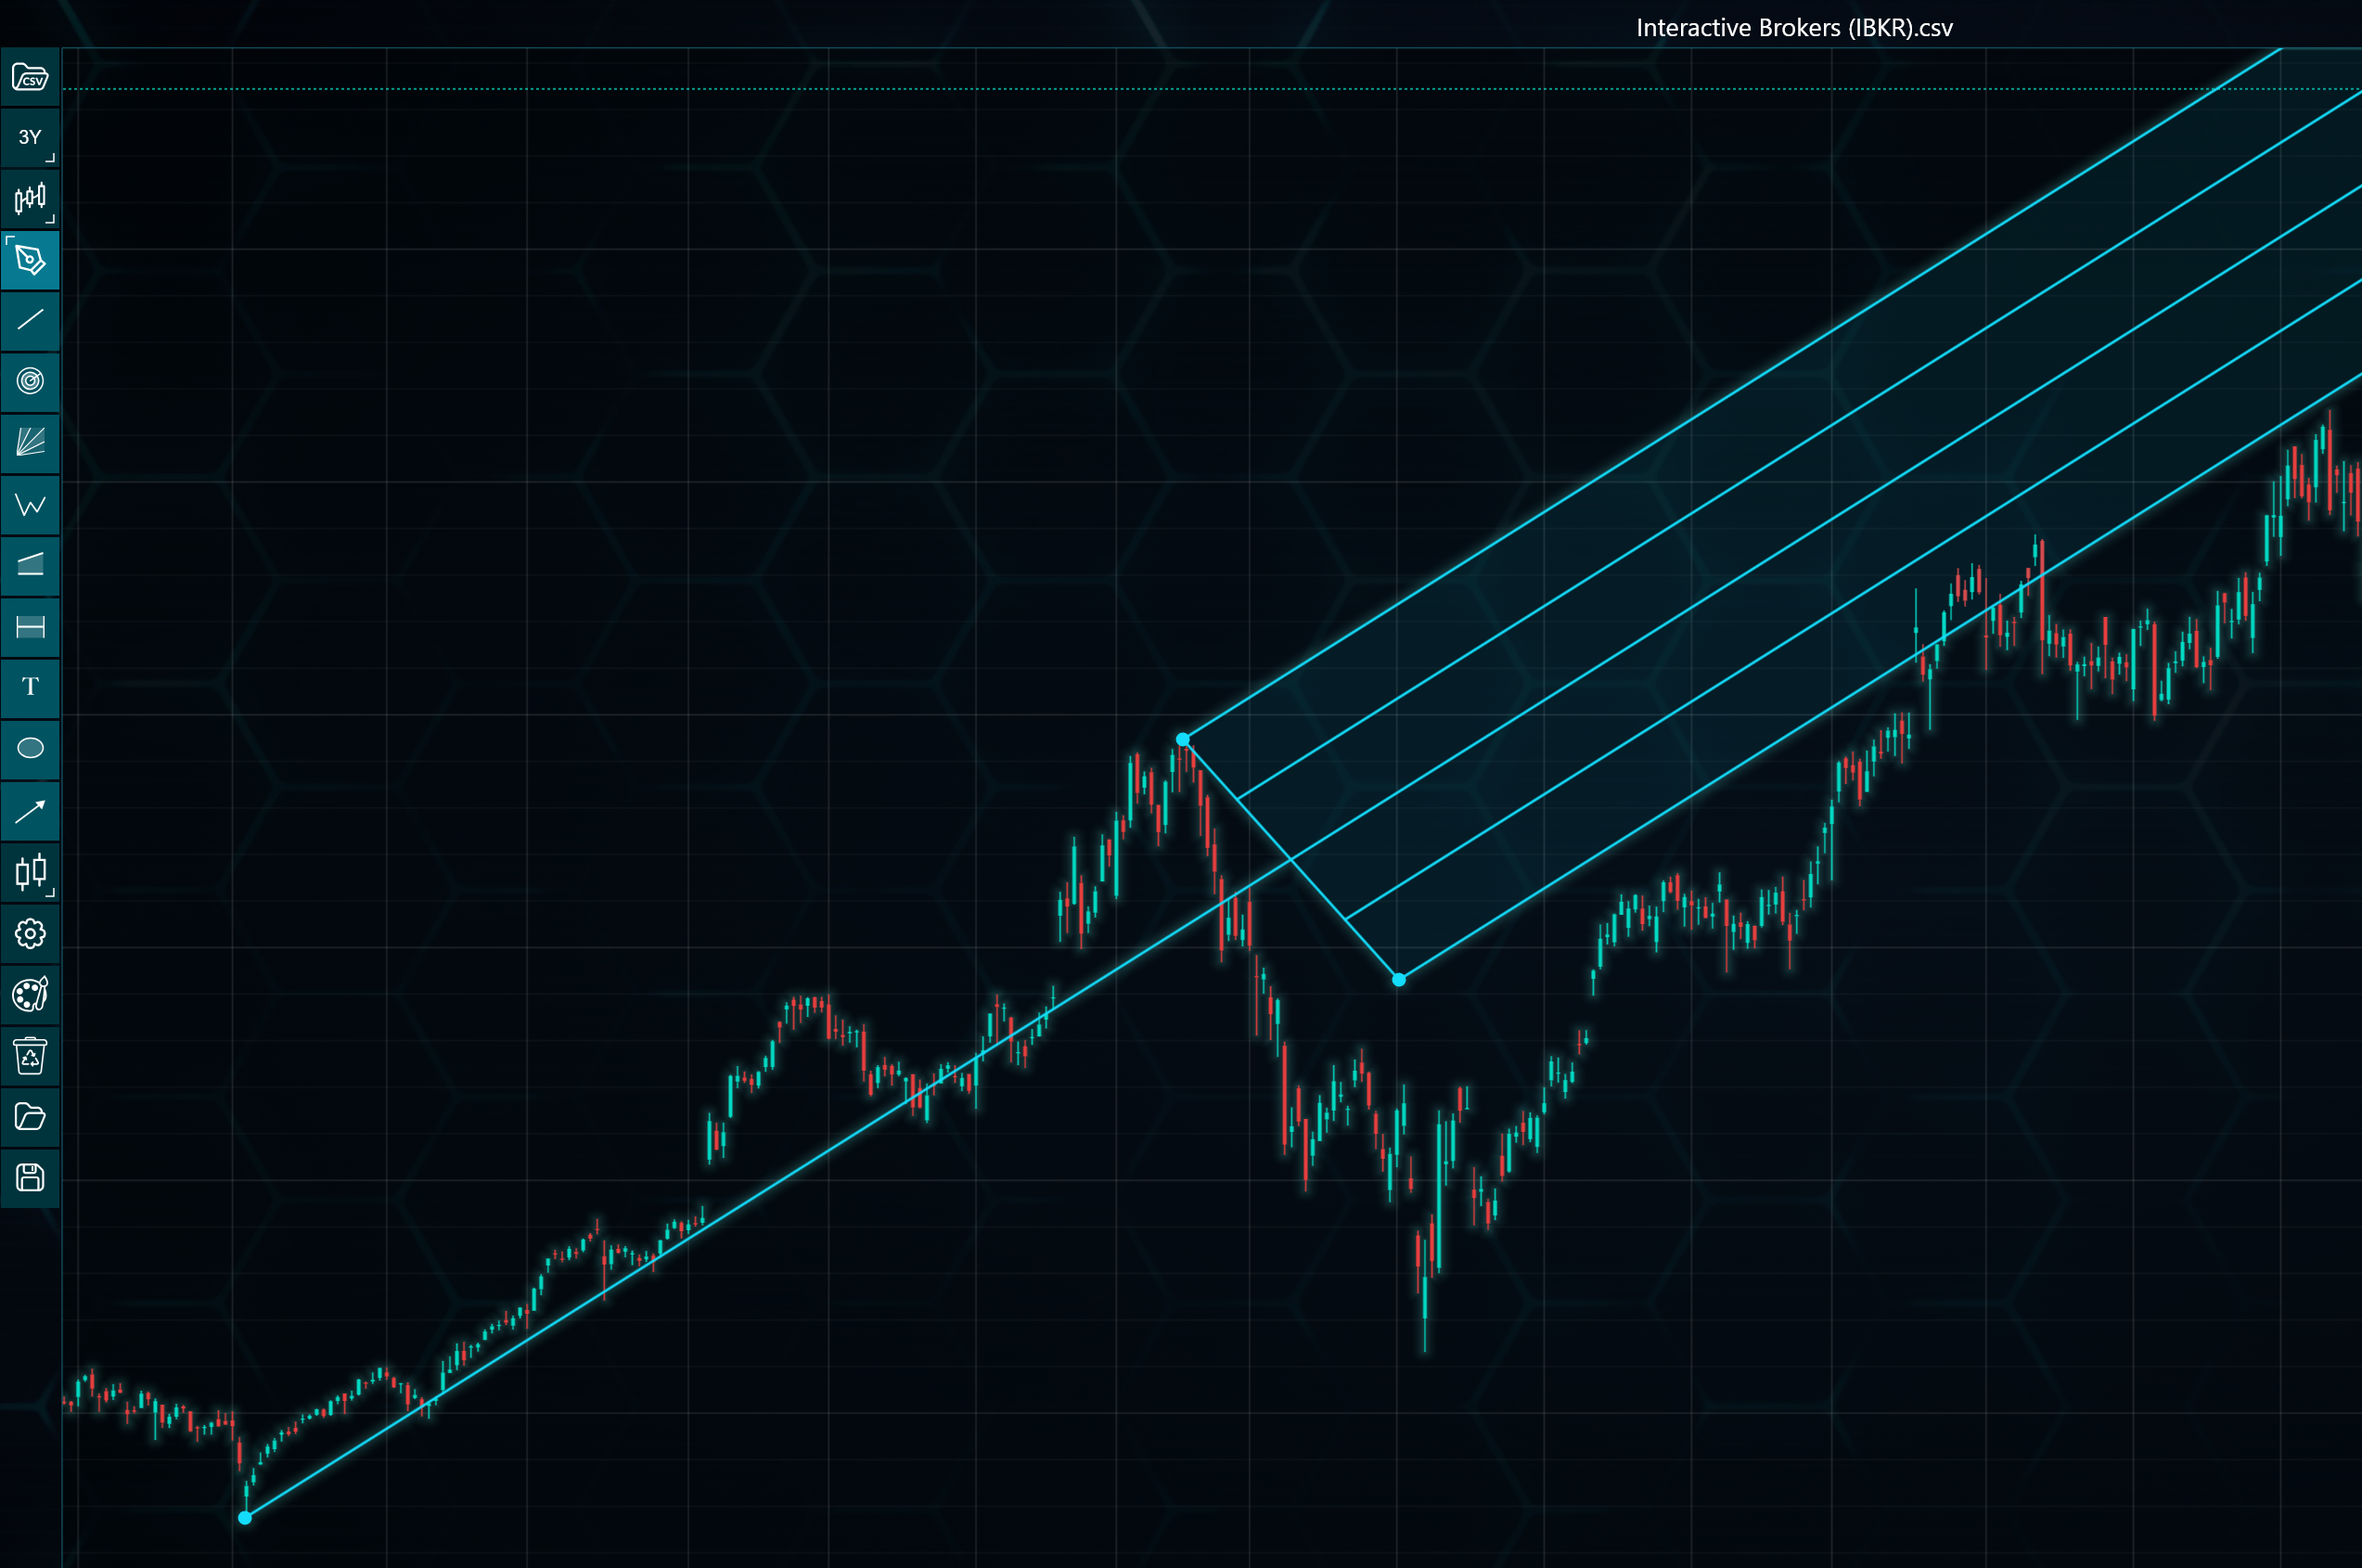
Drawing Andrews’ Pitchfork. Currently positioning the last point. The point follows the mouse cursor until the chart has been clicked.
LightningChart JS Trader also has an option to place drawing tools in code instead of via user interface. In case of Andrews’ Pitchfork, this can be done with addPitchfork() method:
tradingChart.drawingTools().addPitchfork(firstX, firstY, secondX, secondY, thirdX, thirdY)The method requires giving position values for each of the three points.
After the Pitchfork has been drawn, LightningChart JS Trader allows configuring its appearance via the setting menu, brought up by right-clicking (double tap in mobile) one of the main points.
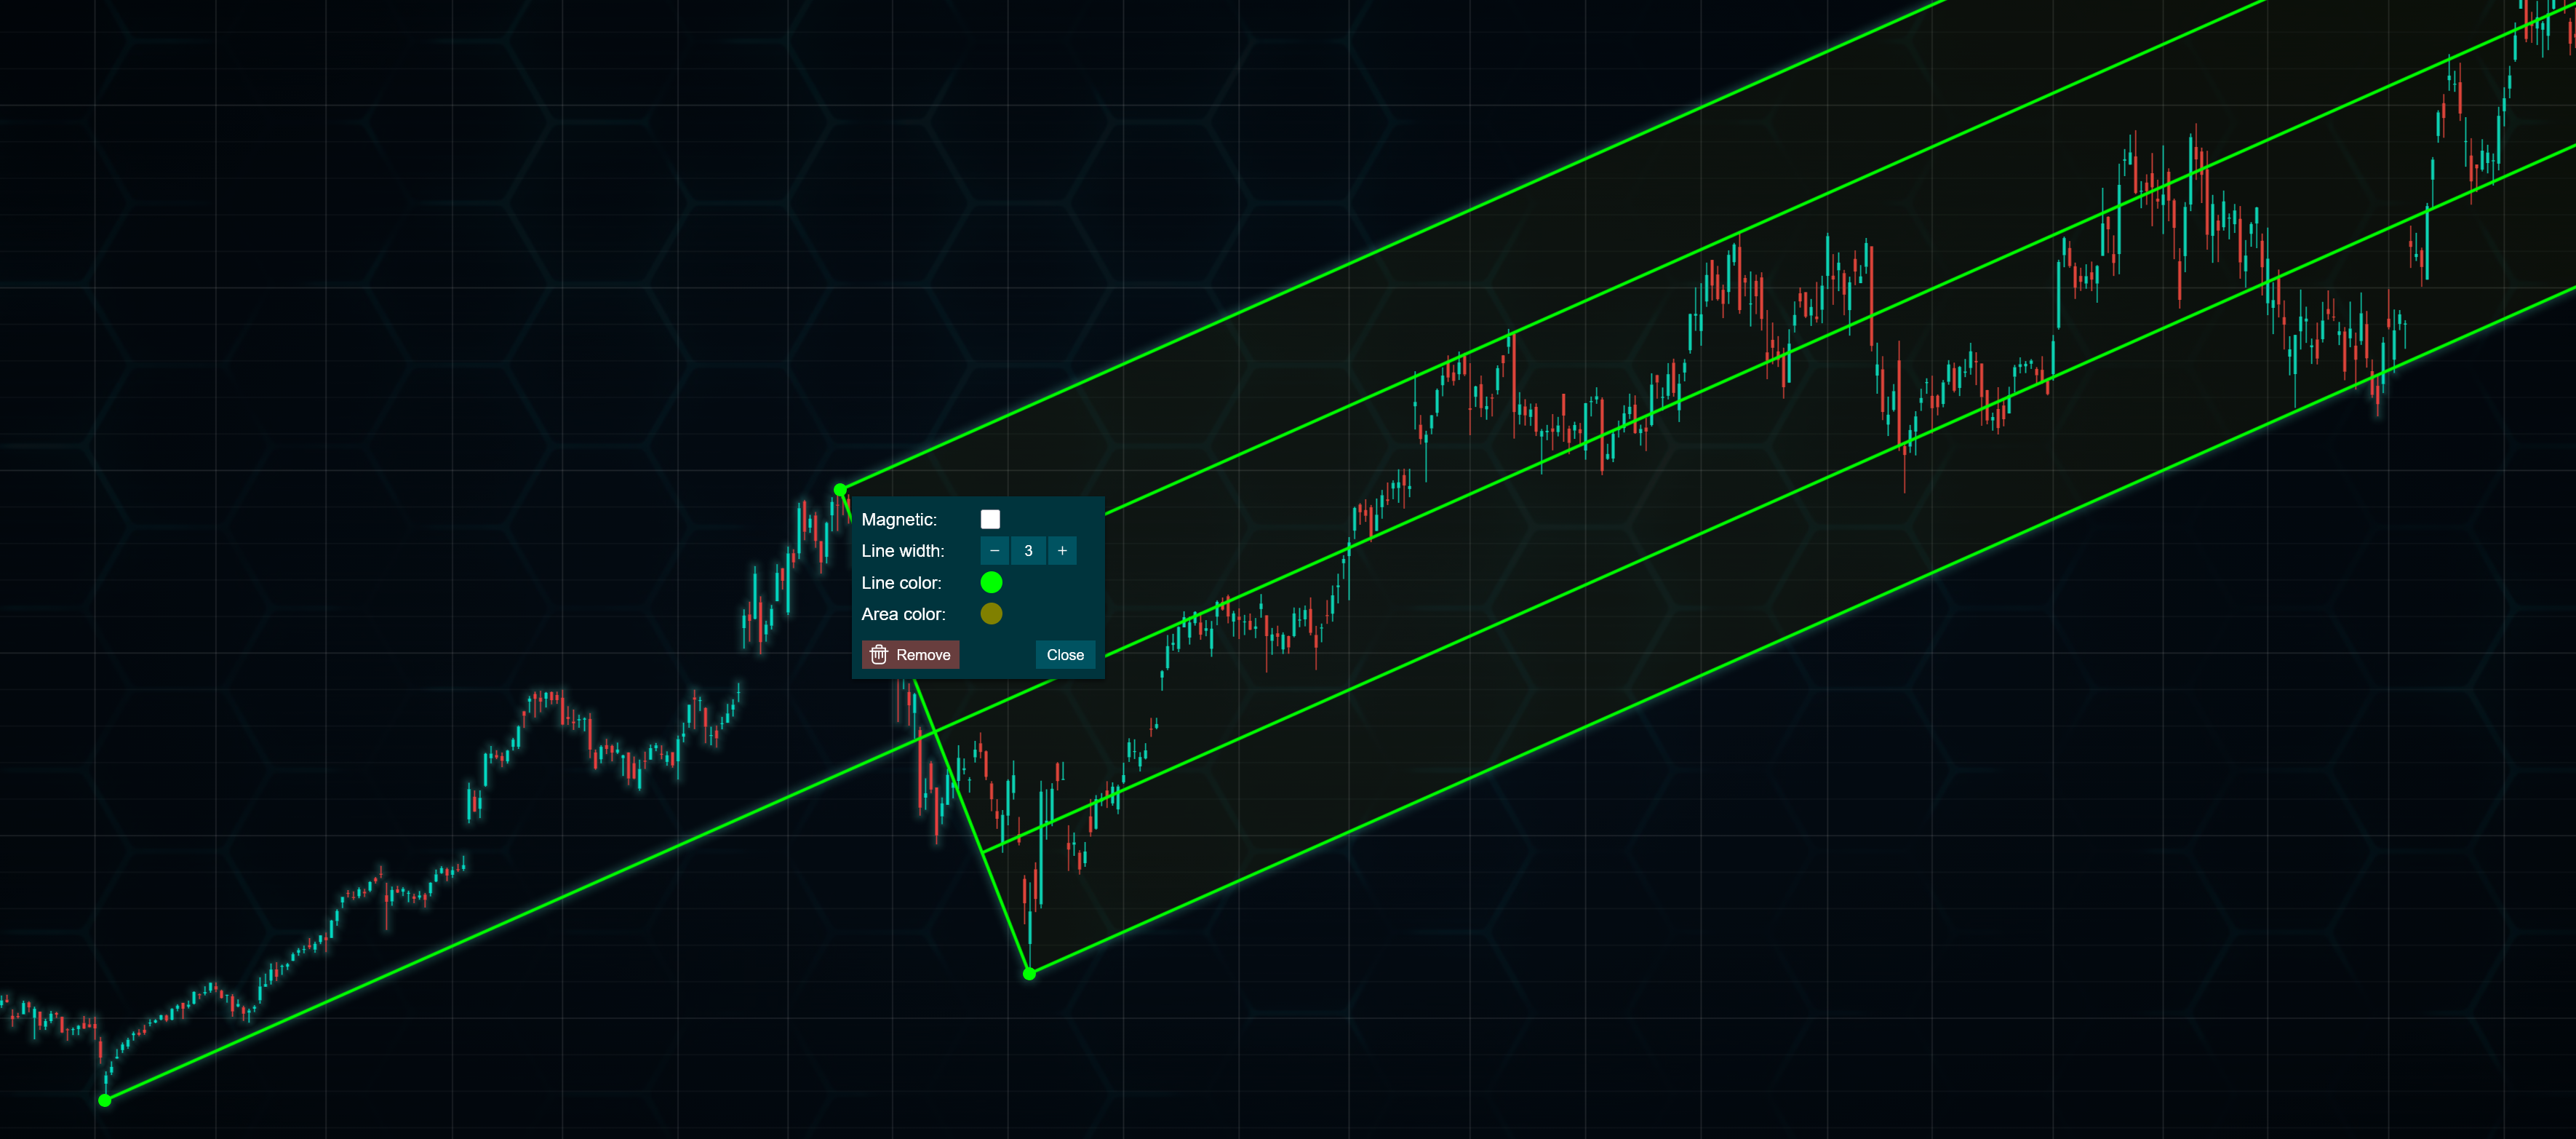
Configuring the Andrews’ Pitchfork. The menu has been brought up by right-clicking the second point.
Conclusion
Andrews’ Pitchfork is a versatile technical analysis tool that helps traders visualize trends, identify dynamic support and resistance, and anticipate potential price movement. Its foundation on the median line principle offers a logical framework for understanding market structure.
While the indicator can provide valuable insights, its effectiveness improves when combined with sound market analysis, confirmation from other indicators, and disciplined risk management. Like any trading tool, consistent practice and experience are key to using Andrews’ Pitchfork successfully.
Continue learning with LightningChart

How to Create a Strip Chart
Written by a human | Updated on April 9th, 2025What is a Strip chart application and what are the modern equivalents to it? Before computers exist or were taking their first steps, a Strip chart was a way to visualize an analog electrical signal. Voltage was...
Data Visualization Template for Electron JS | LightningChart®
Updated on April 4th, 2025 | Written by humanAre you already building cross-platform applications with Electron JS? In some of our previous articles, we’ve worked on TypeScript projects where we created pie charts and vibration chart applications. And as we...
Bar chart race JavaScript
Updated on April 14th, 2025 | Written by humanBar chart race JavaScript When I wrote this article, the COVID-19 pandemic was at its peak point. Today, things are much better thanks to vaccinations that continued their steady positive global effect. With this bar...





If you have any questions, feel free to contact us!
©LightningChart Ltd 2026. All rights reserved.