


Powering real-time analytics
for Motorsports Charts

LightningChart powers next-generation motorsports analytics with ultra-fast, real-time charting built for extreme data volumes. From live race monitoring to deep historical analysis, visualize high-frequency telemetry with unmatched speed, precision, and reliability.

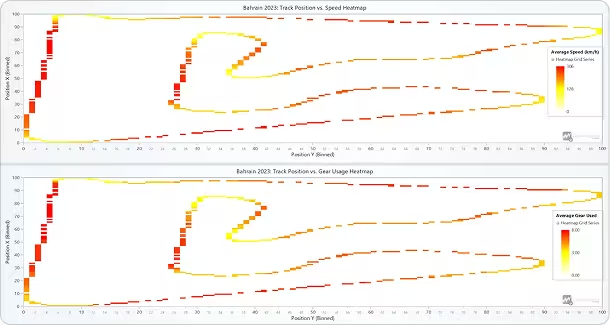
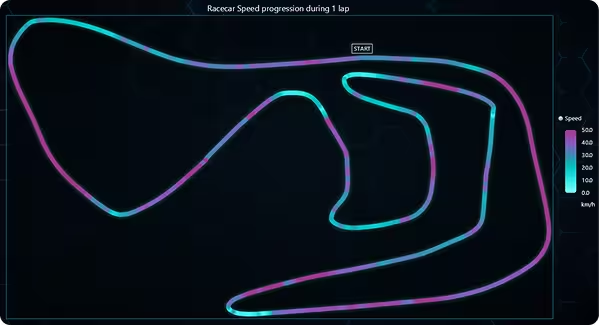
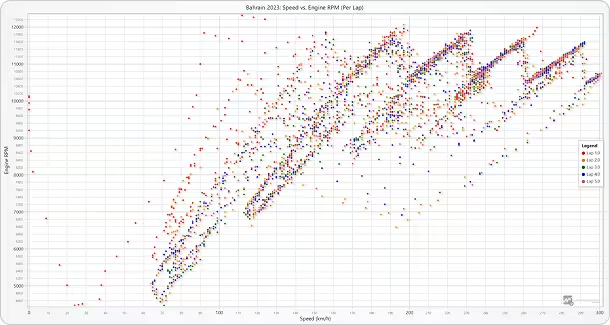
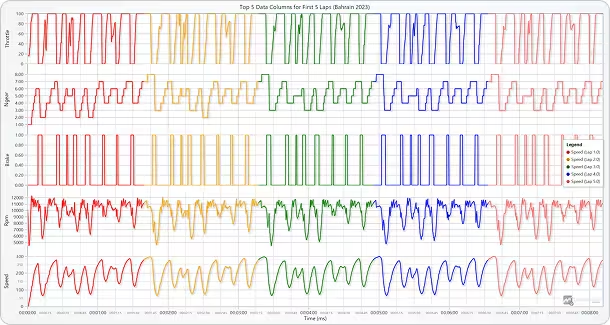
Formula 1 Data Analysis with Python
Formula 1 generates massive volumes of high-frequency telemetry data, from lap times and speed traces to sector performance and sensor readings. Analyzing this data requires visualization tools that can handle dense datasets without compromising performance.
LightningChart Python enables engineers and analysts to explore Formula 1 data and race dynamics with high-performance charts designed for real-time and historical analysis.
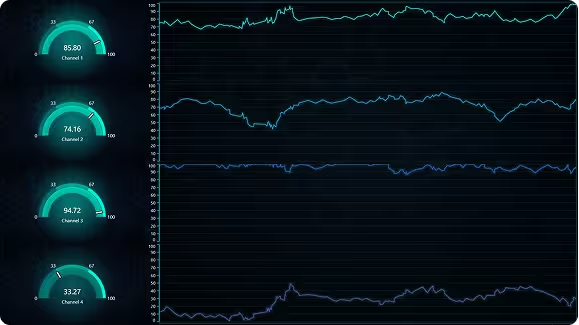
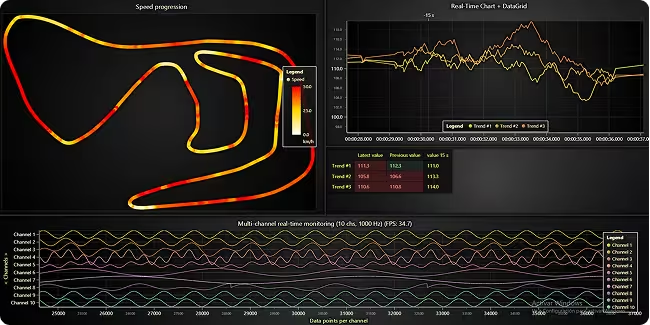
Telemetry Dashboards for Real-Time Data Monitoring with JS
Telemetry dashboards are essential for monitoring fast-changing data streams in applications such as motorsports and connected vehicles. They must display multiple signals simultaneously, update in real time, and remain readable even at high data rates.
LightningChart JS enables high-performance telemetry dashboards that can handle dense, real-time data while maintaining smooth interactions as data is generated.


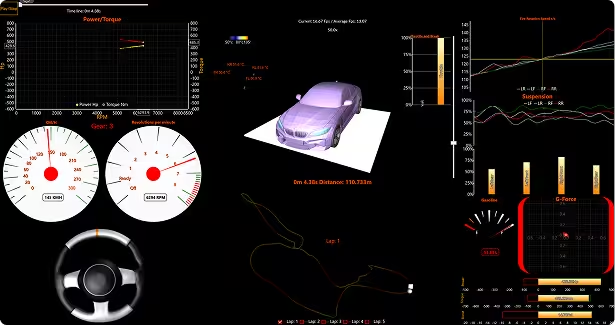
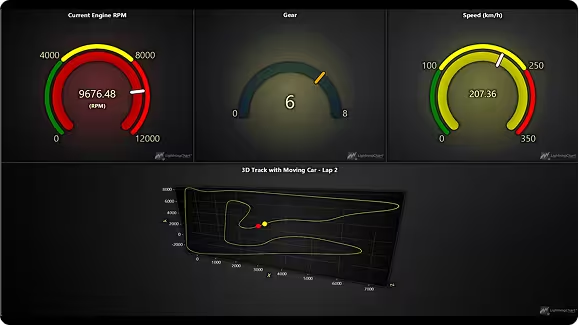
Telemetry Dashboards with .NET
Race car telemetry systems require dashboards capable of rendering multiple high-frequency data streams simultaneously, including RPM, torque, pressure, and positional data.
LightningChart .NET enables the development of advanced race car telemetry dashboards that combine multiple 2D and 3D chart types, real-time data rendering, and interactive features such as tracking, annotations, and cursors.

Why Developers Choose LightningChart
LightningChart is engineered for delivering the fastest-rendering data visualizations, trusted for critical mission success.
Hardware-Accelerated Performance
LightningChart’s visualization controls are GPU-accelerated charts rendered at the highest FPS and fastest load-up speeds.
Functionality
Extensive 2D and 3D charts, fully customizable for high-demand applications including LineSeries, Heatmaps, MapCharts, Surface Grids, and more.
Rich Documentation
Easily get started with plenty of all-level user resources, API documentation, and interactive chart examples.
LightningChart Motorsports Charts are trusted by Engineering and Analytics teams
Top motorsports teams and analytics platforms rely on motorsports charts built with LightningChart for high-performance, real-time telemetry visualization. From instantaneous race data streaming to advanced historical analysis, our charting libraries deliver the speed, precision, and reliability that racing engineers and developers demand under extreme conditions.
Many of the visualization techniques used in motorsports charts originate from automotive engineering, where real-time data analysis and performance monitoring are equally critical.


Browse MotorSports charts
Browse real examples of charts used in advanced monitoring, analytics, and system diagnostics across complex data environments:
Get started
LightningСhart JS
Best for developing web, mobile, desktop, IoT, Cloud, & Intranet applications that require fast data processing times.
The library features 100+ charts, examples source code, & 10+ framework templates including Angular, React, Quasar JS, Ionic, etc.
WebGL-rendered, GPU-accelerated charts for delivering the highest performance & the best user experience.
LightningСhart .NET
Ideal for developing highly demanding desktop applications, e.g., scientific, engineering, finance, medicine, etc.
The library features 100+ chart types, signal tools, and examples source code supported in WinForms, UWP, and WPF.
Hardware-accelerated controls for lightning-fast rendering performance and efficient use of resources
LightningСhart Python
For data scientists, researchers, or educators looking to enhance their data analysis capabilities.
The library features 100+ plot types, compatible with different Python notebooks. Supports PyQt & PySide integration.
WebGL-rendered, GPU-accelerated 2D & 3D plotting library for high performance & the best user experience.
Developing motorsports applications with LightningChart
Read how customers have used LightningChart motorsports charts in their projects


If you have any questions, feel free to contact us!
©LightningChart Ltd 2026. All rights reserved.