









LightningChart JS v.3.0.0 – high-performance 2D & 3D JavaScript Charts now better than ever!
There are new features, significant improvements in existing features, few fixes, and yet again a powerful performance boost in this new version. We are happy to announce a new major release for LightningChart® JS, version 3.0.0!
New additions to LightningChart JS
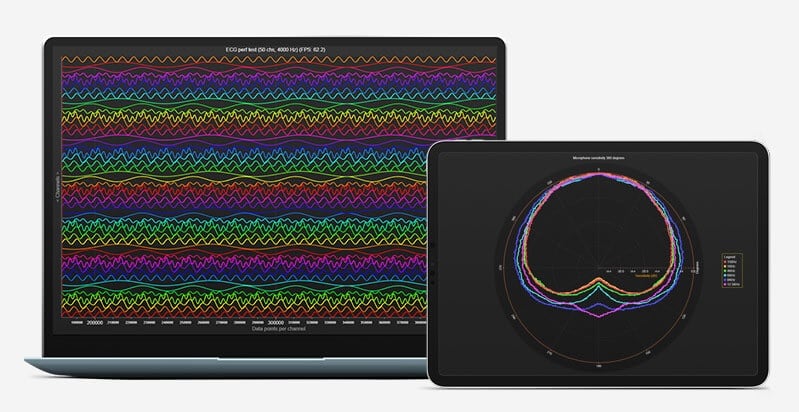
User-friendly JS charting library with power behind it
For example, Line Series have been significantly optimized on the performance side; what this means for our users is less CPU resource usage by LCJS, and more resources for users’ web page to use (LCJS strains web page less). With LightningChart JS, users can now effortlessly visualize larger data sets even with weaker hardware.
We really want to serve our customers, so happy to say, that there are now configuration options for changing mouse interactions to different mouse buttons. This is a customer request we got previously. There is also a pack of other improvements and fixes introduced in the new version. All changes are visible in the full changelog. We prepared a migration guide for you to seamlessly migrate from 2.1.1 to 3.0.0. More about LightningChart JS, check our Interactive Examples to play with the library yourself!
Happy Coding!
See more news
LightningChart .NET v.12.6.1
LightningChart .NET v.12.6.1 is out now!Features of LightningChart® .NET version 12.6.1In this release we added new features, made several improvements and fixed dozens of errors. We upgraded target framework (from .NET 8.0 to 10.0), added Universal-Data-Parser...
Trend Lines in Trading
Trend lines are among the simplest yet most powerful tools in technical analysis. They help traders visualize market direction, identify potential support and resistance levels, and make more informed trading decisions. Despite their simplicity, trend lines remain a...
Announcement: Baumer as LightningChart customer
Enabling High-Performance Visualization of Industrial Sensor Data with LightningChartDiscover how Baumer uses LightningChart to configure and visualize data from a wide variety of industrial sensors and create responsive, data-rich visualization...
Best Python Charting Library in 2026
Python's charting ecosystem is large, overlapping, and regularly misunderstood. Most comparison guides stop at Matplotlib, Plotly, and Seaborn. This one goes further: it covers what happens when your datasets grow large, your update rates increase, or your chart types...



If you have any questions, feel free to contact us!