


HTMLCreate 3 easy HTML charts with JavaScript
TutorialFast tutorial on how to create a barChart, cursorChart, and donutChart in HTML with JavaScript
Written by a human | Updated on April 9th, 2025
HTML Charts with JavaScript
HTML charts are standard and suitable for all-level developers with a simple implementation. The issue with basic HTML 5 charts is their limited functionalities and performance capabilities, for instance, the data points count or rendering performance.
Today we will do a quick implementation of LightningCharts with an HTML template where we’ll take the development of HTML to the next level using JavaScript and the LightingChart JS performance-oriented library.
Previously, I worked on a comparison of some graphics libraries, some of those libraries can be used as embedded JavaScript code. So, it can be beneficial if you don’t have enough experience with advanced web development (MVC with C#, Java, Angular, etc.) as you’ll be able to recreate high-performance visualizations using HTML code. We will create three charts:
 Download the project to follow the tutorial
Project Overview
The next video shows an example of how HTML charts with JavaScript look when implementing the “lc js” HTML template. This application features three different chart types:
You’ll see that for this specific project, you’ll just need a web browser to visualize the HTML charts. Despite most of the traditional JS charts for HTML, this time we’ll create something more advanced that secures high-performance and fast interactive HTML charts with JavaScript by using LightningChart JS.
You can learn more about creating HTML using LightningChart JS in our GitHub repository.
Configuring the template
- Please, download the template that is provided in this article.
- You will see a file tree where each HTML file will have the Head – Style – Body structure.
In the Head section, we will specify the properties of the page. Here we will specify the style properties (CSS) for the template. In the body, we will embed our JavaScript code. For HTML, we’ll use the <script> tag, to work with client-side JavaScript. The HTML template is very simplified, but you can edit it and make it more complex as you like.
Note: Contrary to our previous articles and tutorials, this time we won’t run the NPM INSTALL code as this is not a NodeJS project.
Bar Chart
In the three files, we will see the following source script section:
const {
    lightningChart,
    emptyLine,
    AutoCursorModes,
    UIOrigins,
    LegendBoxBuilders,
    AxisScrollStrategies,
    AxisTickStrategies,
    UIElementBuilders,
    Themes
} = lcjs

const lc = lightningChart()
The IIFE file (Immediate Invoked Function Expression), contains all the Lightning Chart functions and properties that we need to create charts. Importing this file, we will be able to extract the required parts for each chart:
const {
    lightningChart,
    emptyLine,
    AutoCursorModes,
    UIOrigins,
    LegendBoxBuilders,
    AxisScrollStrategies,
    AxisTickStrategies,
    UIElementBuilders,
    Themes
} = lcjs

const lc = lightningChart()
Now we have to construct an interface for the bar chart. This interface will contain all the properties for this chart.
let barChart
        {
            barChart = (options) => {
                const figureThickness = 10
                const figureGap = figureThickness * .25
                const groupGap = figureGap * 3.0
                const groups = []
                const categories = []
In the image above, we are specifying the sizes for all the vertical bars. For this chart, is necessary to the axes and chart object. In the chart object, we will specify global properties, like the title, page padding and mouse behaviors.
const chart = lc.ChartXY(options)
	.setTitle('Grouped Bars (Employee Count)')
    .setAutoCursorMode(AutoCursorModes.onHover)
  	// Disable mouse interactions (e.g. zooming and panning) of plotting area
    .setMouseInteractions(false)
    // Temporary fix for library-side bug. Remove after fixed.
    .setPadding({ bottom: 30 })

// X-axis of the series
const axisX = chart.getDefaultAxisX()
    .setMouseInteractions(false)
    .setScrollStrategy(undefined)
    // Disable default ticks.
    .setTickStrategy(AxisTickStrategies.Empty)

// Y-axis of the series
const axisY = chart.getDefaultAxisY()
    .setMouseInteractions(false)
    .setTitle('Number of Employees')
    .setInterval(0, 70)
    .setScrollStrategy(AxisScrollStrategies.fitting)
To create an object that refers to a specific axis, we will use the function [getDefaultAxisX -Y] and add some other properties. The [setAutoCursor] function, will let us modify the visual properties of the cursor over the chart.
chart.setAutoCursor(cursor => cursor
  .disposePointMarker()
  .disposeTickMarkerX()
  .disposeTickMarkerY()
  .setGridStrokeXStyle(emptyLine)
  .setGridStrokeYStyle(emptyLine)
	.setResultTable((table) => {
		table
			.setOrigin(UIOrigins.CenterBottom)
  })
)
The emptyLine property will hide the line indicators:

The following function creates a Rectangle series (for each category), which adds the cursor functionality to it.
const createSeriesForCategory = (category) => {
  const series = chart.addRectangleSeries()
  // Change how marker displays its information.
	series.setCursorResultTableFormatter((builder, series, figure) => {
    // Find cached entry for the figure.
    let entry = {
      name: category.name,
    	value: category.data[category.figures.indexOf(figure)]
    }
    // Parse result table content from values of 'entry'.
    return builder
      .addRow('Department:', entry.name)
			.addRow('# of employees:', String(entry.value))
  })
	return series
}
In the previous function, we added the name of the department and the number of employees. Those values will be added now as a row data inside the vertical line. In the following property, we can specify the behavior of those values as a “legend box”.
const legendBox = chart.addLegendBox(LegendBoxBuilders.VerticalLegendBox)

    .setAutoDispose({
        type: 'max-width',
        maxWidth: 0.20,
    })
    .setTitle('Department')
The following function redraws the bar chart based on the values of groups and categories:
const redraw = () => {
    let x = 0
    for (let groupIndex = 0; groupIndex < groups.length; groupIndex++) {
        const group = groups[groupIndex]
        const xStart = x
        for (const category of categories) {
            const value = category.data[groupIndex]
            if (value !== undefined) {
                // Position figure of respective value.
                const figure = category.figures[groupIndex]
                figure.setDimensions({
                     x,
                     y: 0,
                     width: figureThickness,
                     height: value
                })
                // Figure gap
                x += figureThickness + figureGap
            }
        }
        // Position CustomTick
        group.tick.setValue((xStart + x - figureGap) / 2)

        // Group gap
        x += groupGap
    }
    axisX.setInterval(-(groupGap + figureGap), x)
}
We have to add groups and categories. For each category we will draw a bar using the redraw function. Finally the barChart object will provide the categories and groups.
const addGroups = (names) => {
    for (const name of names)
        groups.push({
            name,
            tick: axisX.addCustomTick(UIElementBuilders.AxisTick)
                .setGridStrokeLength(0)
                .setTextFormatter((_) => name)
        })
}
const addCategory = (entry) => {
    // Each category has its own series.
    const series = createSeriesForCategory(entry)
        .setName(entry.name)
    entry.figures = entry.data.map((value) => series.add({ x: 0, y: 0, width: 0, height: 0 }))
    legendBox.add(series)
    categories.push(entry)
    redraw()
}
// Return public methods of a bar chart interface.
return {
    addCategory,
    addGroups
}
To finish, we can specify the theme (UI) to our chart and add the categories and data to this object.
const chart = barChart({
    theme: Themes.darkGreen,
})

// Add groups
chart.addGroups(['Finland', 'Germany', 'UK'])

// Add categories of bars
const categories = ['Engineers', 'Sales', 'Marketing']
const data = [
	[50, 27, 24],
  [19, 40, 14],
  [33, 33, 62]
]
data.forEach((data, i) =>
	chart.addCategory({
  	name: categories[i],
    data
    })
)
Donut Chart
Now, we need to create an object that will contain all the properties for this type of chart. In this case, we will create the [donut] object. We can add the theme and type chart properties. For the HTML properties, we can set the title, padding, animation, and radius properties:
const donut = lightningChart().Pie({
theme: Themes.darkGold,
type: PieChartTypes.LabelsInsideSlices
})
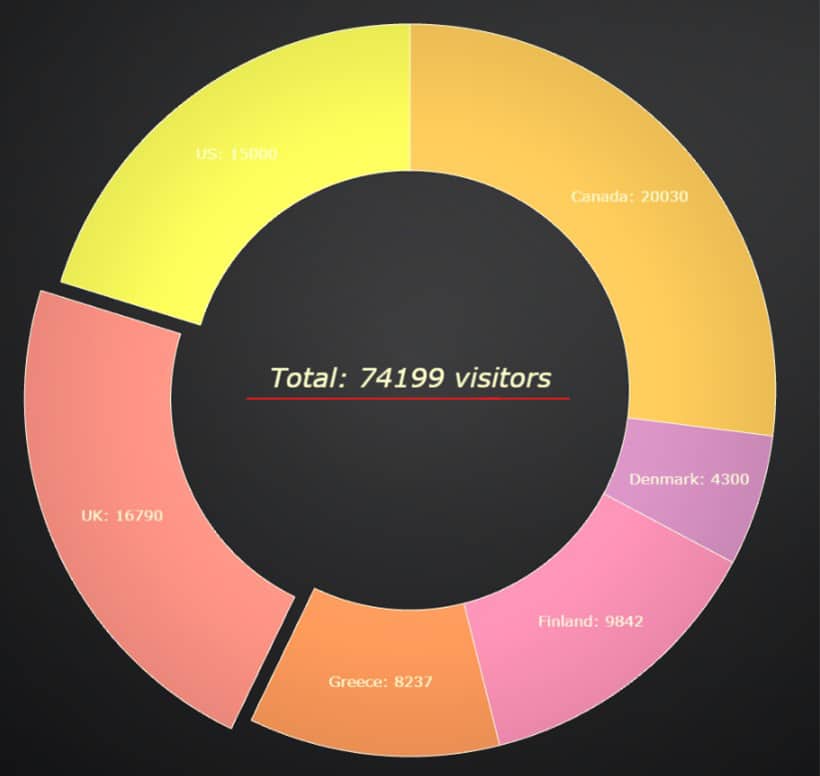
.setTitle('Inter Hotels - hotel visitors in June 2016')
.setPadding({ top: 40 })
.setAnimationsEnabled(true)
.setMultipleSliceExplosion(false)
// Style as "Donut Chart"
.setInnerRadius(60)
// ----- Static data -----
const data = {
country: ['US', 'Canada', 'Greece', 'UK', 'Finland', 'Denmark'],
values: [15000, 20030, 8237, 16790, 9842, 4300]
}The [data] object, will be a JSON object that will contain the data to be displayed on this chart. This JSON can be imported from another file, for this example, I created the JSON object directly in the embedded code. In the following function, we will map all the JSON members inside of an array object:
const processedData = []
let totalVisitor = 0
for (let i = 0; i < data.values.length; i++) {
    totalVisitor += data.values[i]
    processedData.push({ name: `${data.country[i]}`, value: data.values[i] })
}
Now we can map all the members inside the array object. All the values will be added as a new “slice” in the donut (using the [addSlice] function).
processedData.map((item) => donut.addSlice(item.name, item.value))
donut.setLabelFormatter(SliceLabelFormatters.NamePlusValue)
// ----- Add LegendBox -----
donut.addLegendBox(LegendBoxBuilders.HorizontalLegendBox)

    .setAutoDispose({
        type: 'max-width',
        maxWidth: 0.80,
    })
    .add(donut)
The [addLegendBox] function will create a box with the name of the slices in the donut. We can create it as a horizontal box or a Vertical box:

To finish with this chart, we can add HTML text with some properties.
donut.addUIElement(UIElementBuilders.TextBox)
    .setPosition({ x: 50, y: 50 })
    .setOrigin(UIOrigins.CenterTop)
    .setDraggingMode(UIDraggingModes.notDraggable)
    .setMargin(5)
    .setTextFont(fontSettings => fontSettings.setSize(25))
    .setText(`Total: ${totalVisitor} visitors`)
    .setBackground((background) => background
        .setFillStyle(emptyFill)
        .setStrokeStyle(emptyLine)
    )
This can be helpful to show summary data:
Cursor Chart
For this chart we have the following three constants:
// names of the data the series
const names = ["Stock Price A", "Stock Price B", "Stock Price C"];
// define date that matches value of 0 on date time axis.
const dateOrigin = new Date(2020, 0, 1);
// X step between data points.
const dataFrequency = 30 * 24 * 60 * 60 * 1000;
The array [names] will contain three categories; each category will correspond to the lines in the chart. We will now create the chart object. The chart object will have the type [ChartXY]. we can add some UI properties, like the theme and the title.
To configure the Axes, we will use the [getDefaultAxis] function. For axis X, we will specify the calculation strategy, in this case [DateTime]. We can set the origin date using the value of the dateOrigin constant.
// Create a XY Chart.
const chart = lightningChart()
  .ChartXY({
    theme: Themes.darkGold,
  })
  // Disable native AutoCursor to create custom
  .setAutoCursorMode(AutoCursorModes.disabled)
  // set title of the chart
  .setTitle("Custom Cursor using HTML");

// Configure X axis as date time.
chart
  .getDefaultAxisX()
  .setTickStrategy(AxisTickStrategies.DateTime, (tickStrategy) =>
    tickStrategy.setDateOrigin(dateOrigin)
  );

chart.getDefaultAxisY().setTitle("Stock price variation €");
To fill our chart, we need to create a series data. For this chart, we will feed the series array. The size of the array is three, referring to the lines shown in the chart. The limit of points will be twenty, while the values for the X-axis, will be calculated using the [dataFrequency] constant.
const series = new Array(3).fill(0).map((_, i) => {
  const nSeries = chart
    .addPointLineSeries()
    .setMouseInteractions(false)

  createProgressiveTraceGenerator()
    .setNumberOfPoints(20)
    .generate()
    .toPromise()
    .then((data) => {
      return nSeries.setName(names[i]).add(
        data.map((point) => ({
          x: point.x * dataFrequency,
          y: point.y,
        }))
      );
            });
  return nSeries;
});
Now we will add the text boxes to the data points. Basically, we created some HTML divs with ids. Those divs will be modified dynamically using the ids as identifiers.
const styleElem = document.head.appendChild(document.createElement("style"));
const textBox = document.createElement("div");
textBox.id = "resultTable";
const line = document.createElement("div");
line.id = "line";
const line2 = document.createElement("div");
line2.id = "line2";
const arrow = document.createElement("div");
arrow.id = "arrow";
textBox.appendChild(line);
textBox.appendChild(line2);
textBox.appendChild(arrow);
chart.engine.container.append(textBox);
You will find the [onSeriesBackgroundMouseMove] function. Here you will be able to modify the cursor behaviors, for example, add fade effects, modify the scale of the text boxes and add HTML properties to the cursor.
chart.onSeriesBackgroundMouseMove((_, event) => {
  const mouseLocationClient = { x: event.clientX, y: event.clientY };
  // Translate mouse location to LCJS coordinate system for solving data points from series, and translating to Axes.
  const mouseLocationEngine = chart.engine.clientLocation2Engine(
    mouseLocationClient.x,
    mouseLocationClient.y
  );

  // Translate mouse location to Axis.
  const mouseLocationAxis = translatePoint(
    mouseLocationEngine,
    chart.engine.scale,
    series[0].scale
  );

  // Solve nearest data point to the mouse on each series.
  const nearestDataPoints = series.map((el) =>
    el.solveNearestFromScreen(mouseLocationEngine)
  );
Finally, we just need to add the CSS style for the divs that we created before. We can append the CSS string class to the document header.
function addStyle(styleString) {
  const style = document.createElement("style");
  style.textContent = styleString;
  document.head.append(style);
}
Inside the addStyle object, we will find the properties for each div, using the ids that we specified before:
addStyle(`
    #resultTable {
        background-color: rgba(24, 24, 24, 0.9);
        color: white;
        font-size: 12px;
        border: solid white 2px;
        border-radius: 5px;
        width: 142px;
        // height: 110px;
        height: auto;
        top: 0;
        left: 0;
        position: fixed;
        padding: 0;
        pointer-events:none;
        z-index: 1;
        transition: left 0.2s, top 0.2s, opacity 0.2s;
        opacity: 0.0;
    }
Conclusion: HTML charts with JavaScript
In the previous articles, we used technologies like Node JS, Electron JS, Quasar JS, and soon Android and iOS… but in all of them, previous knowledge of the use of these frameworks is needed. Not all people can spend a lot of time on complex web projects, or maybe they just need a more professional way to display their data, making use of a simple file that allows us to display our data.
The goal of this article is to demonstrate the flexibility of LightningChart as embedded code within a simple HTML template and how HTML charts with JavaScript can be created easily. LightningChart provides us with various examples or templates that allow us to create advanced charts by simply copying and pasting the code into the script tags.
It’s obvious that customizing these charts can get complicated, but with previous and upcoming articles, we’ll try to cover every need so that a simple HTML implementation might be easy enough. Another great point is the excellent graphical interface that LC provides us. Without the need to create complex JavaScript, JQuery, or CSS functions, we can generate beautiful charts with great compatibility with any web browser just with HTML charts with JavaScript.

Omar Urbano
Software Engineer
Continue learning with LightningChart

Andrews’ Pitchfork in Technical Analysis
Andrews' Pitchfork is one of the most respected technical analysis tools used by traders to identify potential support and resistance levels, trend direction, and future price paths. Developed by Dr. Alan H. Andrews, the indicator is based on the principle that prices...

React Charting Performance
Here's a scenario that plays out across development teams every few months. Someone builds a React dashboard, picks Recharts or Victory because they're popular, the devs love them, and the first demo looks great. Then the dataset gets bigger. Or the data starts...

Javascript Charting Library comparison 2026
Every year someone publishes a listicle of JavaScript charting libraries. They screenshot a demo, note the GitHub stars, paste in the npm install command, and call it a day. Then you follow their recommendation, get six months into your project, and discover that your...


If you have any questions, feel free to contact us!
©LightningChart Ltd 2026. All rights reserved.