IntroductionThis article is based on a real use case of LightningChart JS in optical fiber analysis. Optical fiber...


Regional Account & Marketing Executive (China, Japan and South Korea)
+358 503 543 706
Book a meeting
Regional Account Manager (North America, South America)
+358 505 528 995
Book a meetingOur dedicated sales team is ready to help you find the perfect solution for your data visualization needs. Don't hesitate to reach out for personalized assistance or to schedule a demo of our products.

Regional Account & Marketing Executive (China, Japan and South Korea)
+358 503 543 706
Book a meetingRegional Account Manager (North America, South America)
+358 505 528 995
Book a meetingOur dedicated sales team is ready to help you find the perfect solution for your data visualization needs. Don't hesitate to reach out for personalized assistance or to schedule a demo of our products.


IntroductionThis article is based on a real use case of LightningChart JS in optical fiber analysis. Optical fiber...
IntroductionIn this article, we will create a brief project focused on implementing threads to generate multiple...
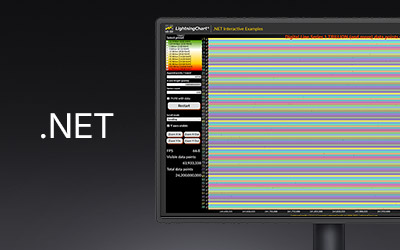
IntroductionWelcome to this new LightningChart .NET article. In this project, we'll create a multi-channel chart where...

Introduction to Temperature Anomalies AnalysisThe increasing global temperature anomalies over the past century are a...

What is the Welles Wilder Smoothing Indicator?The Welles Wilder Smoothing Indicator is a cornerstone in the realm of...

What is Weighted Moving Average?The Weighted Moving Average (WMA) places more weight on recent data values by applying...

What is Volume Weighted Moving Average?The Volume Weighted Moving Average (VWMA) is a crucial technical indicator...

IntroductionIn October 2024, Hurricane Milton made its way across the Atlantic, affecting numerous coastal areas. This...
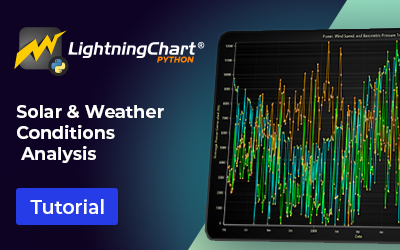
Introduction to Solar and Weather Conditions AnalysisCreating a solar and weather conditions analysis involves the use...
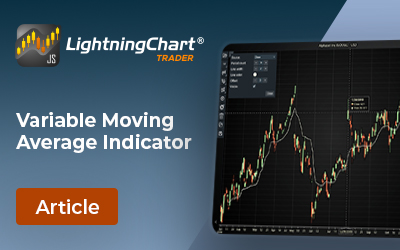
Written by a human | Updated on April 24th, 2025About Variable Moving Average IndicatorThe Variable Moving Average...
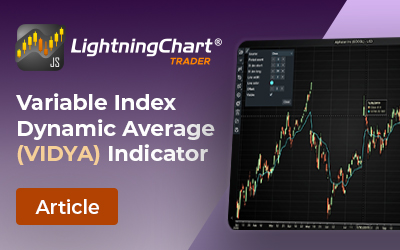
Written by a human | Updated on April 24th, 2025About VIDYA IndicatorIn the world of technical analysis, traders rely...
Written by a human | Updated on April 24th, 2025Triangular Moving Average Indicator In stock trading and technical...