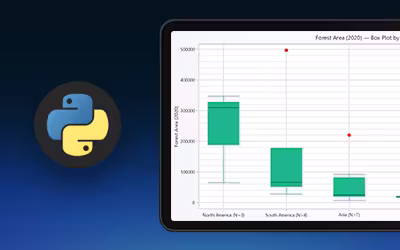
IntroductionThis project presents a focused deforestation and forest-area visualization analysis using a global Kaggle...


Regional Account & Marketing Executive (China, Japan and South Korea)
+358 503 543 706
Book a meeting
Regional Account Manager (North America, South America)
+358 505 528 995
Book a meetingOur dedicated sales team is ready to help you find the perfect solution for your data visualization needs. Don't hesitate to reach out for personalized assistance or to schedule a demo of our products.

Regional Account & Marketing Executive (China, Japan and South Korea)
+358 503 543 706
Book a meetingRegional Account Manager (North America, South America)
+358 505 528 995
Book a meetingOur dedicated sales team is ready to help you find the perfect solution for your data visualization needs. Don't hesitate to reach out for personalized assistance or to schedule a demo of our products.
IntroductionThis project presents a focused deforestation and forest-area visualization analysis using a global Kaggle...
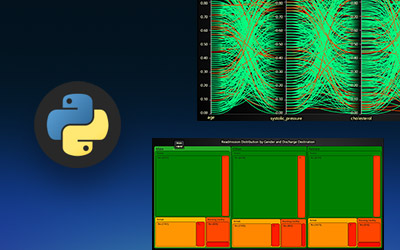
IntroductionThis project presents a comprehensive financial transaction and risk management visualization analysis...

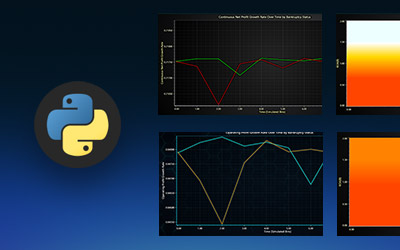
IntroductionThis project presents a comprehensive financial data visualization analysis using the SEC Financial...
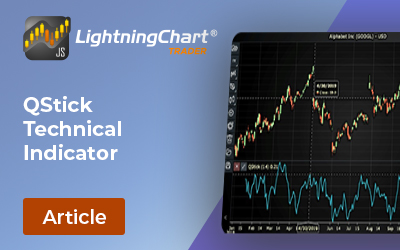
Introduction to the QStick Technical IndicatorThe QStick indicator is a valuable tool for traders seeking to identify...

Introduction to the Prime Number OscillatorThe Prime Number Oscillator (PNO) is a unique technical analysis tool used...
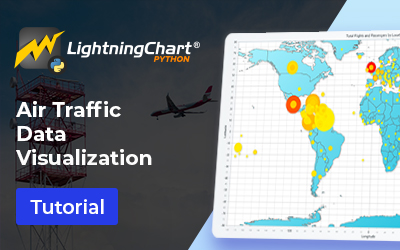
Importance of Air Traffic Data VisualizationAir traffic data visualization is the process of graphically representing...
Introduction to CrossFit data analysisCrossFit demands a unique blend of strength, endurance, power, and agility,...

Introduction to the Pretty Good OscillatorThe Pretty Good Oscillator (PGO) is a momentum-based technical indicator...

IntroductionHi! I’m Jesse and in this article, we will create a drone data visualization project using the...

IntroductionIn the era of digital transformation, sensor-based monitoring systems play a pivotal role in various...
IntroductionEarthquakes are among the most powerful and unpredictable natural disasters, shaping the Earth's surface...
IntroductionTraffic accidents remain a significant global concern, causing substantial economic losses, injuries, and...