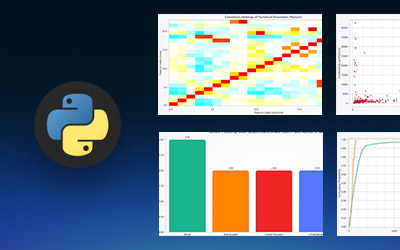
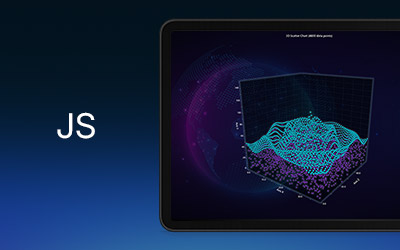
IntroductionThis project presents an analysis of water potability using a curated dataset of water quality monitoring...


Regional Account & Marketing Executive (China, Japan and South Korea)
+358 503 543 706
Book a meeting
Regional Account Manager (North America, South America)
+358 505 528 995
Book a meetingOur dedicated sales team is ready to help you find the perfect solution for your data visualization needs. Don't hesitate to reach out for personalized assistance or to schedule a demo of our products.

Regional Account & Marketing Executive (China, Japan and South Korea)
+358 503 543 706
Book a meetingRegional Account Manager (North America, South America)
+358 505 528 995
Book a meetingOur dedicated sales team is ready to help you find the perfect solution for your data visualization needs. Don't hesitate to reach out for personalized assistance or to schedule a demo of our products.
IntroductionThis project presents an analysis of water potability using a curated dataset of water quality monitoring...

IntroductionThis project presents a focused global analysis of first records of established alien (non-native) species...
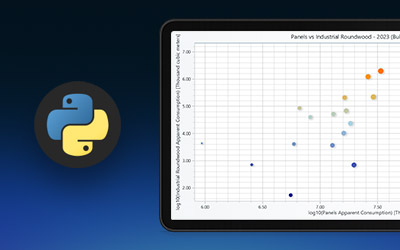
IntroductionThis project presents a focused wood-consumption visualization analysis using the UNECE wood statistics...
Introduction to the Ultimate Oscillator IndicatorThe Ultimate Oscillator (UO) is a technical momentum indicator...

Introduction to Radio Signal AnalysisSignal analysis is the process of examining, interpreting, and extracting...
Introduction to the True Strength Index IndicatorThe True Strength Index Indicator (TSI) is a technical analysis tool...
Introduction to the Stochastic OscillatorThe Stochastic Oscillator is a popular technical analysis indicator that...
Overview and History of Stochastic Momentum IndexThe Stochastic Momentum Index (SMI) is an advanced variation of the...

Introductión to EEG Data AnalysisWhat is EEG? Electroencephalography (EEG) is a non-invasive method used to measure...
Relative Strength Index (RSI) Technical IndicatorThe Relative Strength Index (RSI) is a momentum oscillator that...
Introduction to the Rate Of Change OscillatorThe Rate Of Change Oscillator (ROC) is a fundamental momentum indicator...
Introduction to the Rainbow OscillatorThe Rainbow Oscillator is a sophisticated trend-following indicator that...