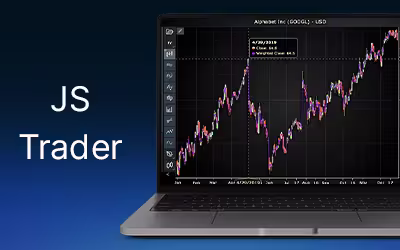
IntroductionThe Weighted Close indicator is a price-based technical analysis tool that gives extra emphasis to the...


Regional Account & Marketing Executive (China, Japan and South Korea)
+358 503 543 706
Book a meeting
Regional Account Manager (North America, South America)
+358 505 528 995
Book a meetingOur dedicated sales team is ready to help you find the perfect solution for your data visualization needs. Don't hesitate to reach out for personalized assistance or to schedule a demo of our products.

Regional Account & Marketing Executive (China, Japan and South Korea)
+358 503 543 706
Book a meetingRegional Account Manager (North America, South America)
+358 505 528 995
Book a meetingOur dedicated sales team is ready to help you find the perfect solution for your data visualization needs. Don't hesitate to reach out for personalized assistance or to schedule a demo of our products.
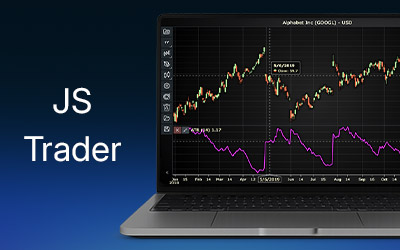
IntroductionThe Weighted Close indicator is a price-based technical analysis tool that gives extra emphasis to the...
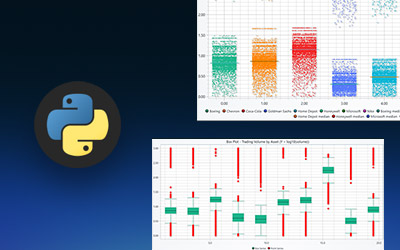
IntroductionThis project presents a focused analysis comparing cryptocurrency and stock market performance using...
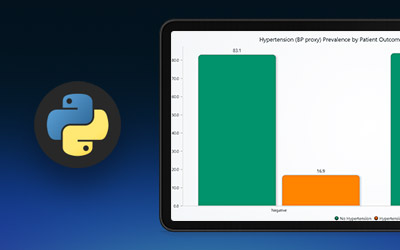
IntroductionThis project delivers a focused analysis of patient outcomes using a hospital diagnostics dataset (hd)...
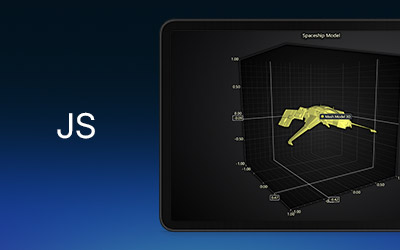
IntroductionWelcome to this short exercise. This short article will focus on how to display a 3D file within a mesh...

IntroductionWe’re back with LightningChart JS, my favorite library for data analysis, so, I’m very happy to work with...

IntroductionIn this article, we will work again with LightningChart JS and real-time parallel coordinate charts. I...

IntroductionHello, I’m back with a brief article about LightningChart .NET where we’ll create a ternary plot using...

IntroductionHello, I'm Omar, and welcome to a new article on LightningChart and .NET. In this article, we will work...

IntroductionHello, in this article, we will work with the Trading library of Lightning Chart .NET. We will create a...

IntroductionThis will be a quite brief, but very useful article, as we will be working with some zooming and panning...

IntroductionIn today's article, we will work with a chart included in the latest version of LightningChart .NET and...

Introduction to the ProjectBased on the importance of air pollution in our life and its impact on health, It is...