


Case StudyMetrum
Case StudyDiscover how Metrum has integrated LightningChart JS into the development of their modern web-based solutions.
Metrum Sweden AB
Founded in 2004 in Gothenburg, Metrum develops advanced system solutions for energy measurement, power quality, and fault analysis. Metrum designs both hardware—high-performance Power Quality measurement instruments—and software for data downloading, visualization, and analysis.
Currently, Metrum is transitioning from a desktop software suite to a modern web-based solution built with Blazor WASM, using DevExpress components. However, due to limitations in DevExpress charts, Metrum has integrated LightningChart JS to meet their advanced visualization needs. Metrum remains committed to innovation, reliability, and environmental responsibility.
About the case study
Case study date
Business industry
Established
LightningChart Solution
08/2025
Measurement systems for the electric industry
2005
JS line Series
Working with LightningChart JS
Metrum has chosen LightningChart as its charting component library provider, mostly due to good performance and quick rendering. Metrum also highlights the capabilities that the library features to help them create their own customizations. Using LightningChart, Metrum has built a JavaScript line series chart widget encapsulated in a Blazor component, leveraging their own customized legends, channel selection functionality, zoom buttons, and other features.
Metrum has used LightningChart in two cases:
- Event data: a few seconds’ worth of high sample data

- Long-time data: a lower sample data but with the possibility to zoom yearly data down to a one-minute range.

Metrum has customized the zooming so that every zoom range is a call to the API appropriately aggregated for the range and display zoomed in by the user. Metrum has also been incorporated, in the long-time-data charts, markers for the events mentioned above, which can be clicked and grant access to the respective data.
“For us, speed is essential, as if it feels slow, the user will simply not want to use the product. Other chart components proved to be far too limited for our needs, which is why we went for LightningChart.”
What are the best qualities of LightningChart?
For us, speed is essential as if it feels slow, the user will simply not want to use the product.
What do you think about LightningChart’s tech support?
The tech support is as fast as the charts themselves and always a good help.
What kind of benefits have you achieved by using LightningChart?
We have been able to achieve great, fast, and professional-looking chart components.
Metrum’s web-based application demo
LightningChart
In cooperation with Metrum Sweden AB
Discover more case studies
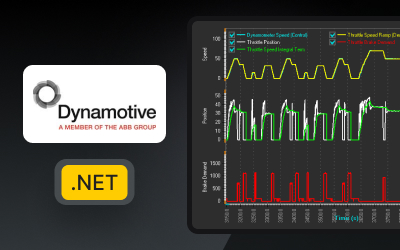
Dynamotive Ltd, ABB Group
DynaMotive, a member of the ABB group, has chosen LightningChart for developing its Telemetry Analytics application.

Husqvarna develops a real time data app using LightningChart
Date of case study: 04/2022Industry of business: Outdoor Power ProductsEstablished: 1689LightningChart solution: XY ChartsHusqvarna ABOriginally founded in 1689, Husqvarna is a company dedicated to manufacturing a variety of outdoor power tools including chainsaws,...
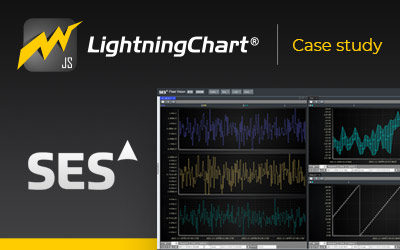
SES Satellite Network
Date of case study: 11/2021Industry of business: Aerospace EngineeringEstablished: 1985LightningChart solution: JS Step SeriesSES S.A.SES specializes in delivering high-performance mobile network connections, broadcasting, real-time intelligence for peacekeepers, and...


If you have any questions, feel free to contact us!
©LightningChart Ltd 2025. All rights reserved.