


Case StudyGANSHORN
Case StudyDiscover how GANSHORN has integrated LightningChart JS into the development of their SpiroScope application.
GANSHORN Medizin Electronic GmbH
The company GANSHORN Medizin Electronic GmbH has been developing, producing, and selling devices for lung function diagnostics in Germany for over 40 years. Focused on the visualization of lung function, their innovative medical technology has achieved breakthroughs by developing state-of-the-art solutions for spirometry tests, lung diffusion analysis, and ergo spirometry tests.
GANSHORN also specializes in the development of plethysmographs, high-precision medical software, and other products for pulmonary function diagnostics.
About the case study
Case study date
Business industry
Established
LightningChart Solution
08/2024
Medical Device Manufacturer(devices for lung function diagnostics)
1982
JS XY Series
Working with LightningChart JS
We were looking for a charting library that would allow us to display lung function measurement data such as flow and volume in real-time in the browser, and be able to render in headless mode too. Since we deliver the software with our devices, the charting library should also be high-performance to run smoothly on our device platform.
“We found what we were looking for with LightningChart JS.”
What LightningChart JS features do you use in your application?
We mainly use the XY display, which is used in pulmonary function diagnostics to display measurement curves and data. In particular, multi-channel real-time display of measurement signals is an essential feature in our applications. Also, the headless rendering mode of LightningChart JS is very important for us. In our usage scenario, it is essential that we can also render patient and measurement reports server-side without them being displayed in the browser.
When clinical information systems request a measurement report from our application, this is always done in the backend and the charts must be rendered in the headless mode.
What do you think are LightningChart JS’s best attributes?
The fact that LightningChart JS offers extremely high-performance charts for medical applications, including multi-channel real-time monitoring visualizations, makes this library a perfect match for us. Also, the fact that we can render and create charts in the backend to be included in patient reports is also a unique feature of LightningChart JS among all the charting libraries in the market.
What kind of actual benefits have you achieved by using LightningChart JS?
We will launch a product line powered by LightningChart JS and look forward to finalizing new cross-platform diagnostic software for our next-generation devices.
GANSHORN: the visualization of the lung function
GANSHORN is developing a new cross-platform diagnostic software platform. This new diagnostic software represents a change from a compiled Windows program to a browser-based, responsive, and flexible solution. GANSHORN has decided to use LightningChart JS for the clear display of measured values and visualizations.
SpiroScope: a server and client version, and a standalone application.
GANSHORN is also developing the first all-in-one spirometer, which will be called SpiroScope. This will run the new software directly on a standard viewport:

The following image shows a screen example of a measurement in the so-called FVC (= forced spirometry measurement), which displays LightningChart JS charting controls and combined indicators.

Demonstrating the measurement maneuver

LightningChart
In cooperation with GANSHORN.
Discover more case studies

Müller-BBM VAS: PAK Cloud Data Management Services | LightningChart®
Date of case study: 07/2021Industry of business: Software DevelopmentEstablished: 1997LightningChart solution: JS Charts (XY & Heatmaps)Müller-BBM VibroAkustik Systeme GmbHMüller-BBM VibroAkustik Systeme or MBBM-VAS is a global provider for integrated solutions...
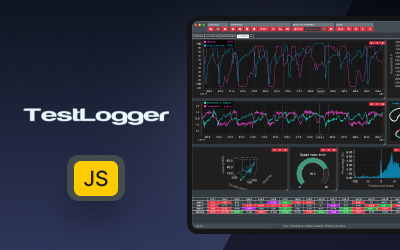
TestLogger: Data Analytics for Racing | LightningChart®
Data analytics for the racing system by TestLogger provides systems for radio-controlled racing vehicles implementing LightningChart® JS.
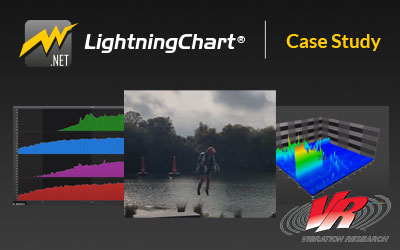
Case Study Vibration Research | LightningChart®
Date of case study: 06/2021Industry of business: Sound & Vibration Testing and AnalysisEstablished: 1995LightningChart solution: .NET, XY charts and 3D chartsVibration Research case study. Sound & vibration analysis software needs high-performance from a...


If you have any questions, feel free to contact us!
©LightningChart Ltd 2025. All rights reserved.