


LightningChart JS TraderHow to use Volatility Indicators for Financial Analysis
ArticleLearn how to use volatility indicators in Financial Analysis and how to create them using LightningChart JS Trader
Written by a human | Updated on April 24th, 2025
Introduction to Volatility Indicators
Volatility indicators play a crucial role in technical analysis, providing traders and analysts with insights into market fluctuations and price movements. These tools help gauge the intensity and pace of price changes, aiding in decision-making processes for trading various financial instruments, such as indices and foreign exchange (FOREX) pairs. In this guide, we will explore volatility indicators, how they can be applied to trading indices and FOREX, and review the most popular ones used in financial analysis, particularly in LightningChart LC Trader charts.
What Are Volatility Indicators?
Volatility indicators are technical tools used in financial markets to measure the degree of variation in the price of an asset over a certain period. These indicators give insight into market sentiment by showing how much prices deviate from their average value. When volatility is high, there are large fluctuations in price, suggesting an uncertain or turbulent market, whereas low volatility indicates smaller price movements and a more stable market environment.
In technical analysis, volatility indicators are primarily used to assess risk, determine entry and exit points, and identify potential trend reversals. By understanding how much an asset’s price fluctuates, traders can decide the best times to buy or sell, making these tools essential in both FOREX and indices trading.
Using Volatility Indicators for Analysing Market Fluctuations
Volatility indicators are essential in tracking price movements and market fluctuations. They help in identifying periods of high or low price activity, which can signal opportunities for entering or exiting trades. For example, high volatility often coincides with significant market events, such as economic data releases or geopolitical developments, leading to sharp price movements. On the other hand, low volatility can signal the market is in a consolidation phase, awaiting new trends.
Traders leverage volatility indicators to predict potential breakouts or reversals, thereby enhancing their strategies to optimize returns while minimizing risk. In FOREX trading, understanding volatility is crucial, as currency pairs can experience rapid price movements due to various factors, including interest rate changes and political instability.
What Are Trading Indices and FOREX?

Trading indices and FOREX are two popular markets in the world of financial trading, each with unique characteristics and offering traders different opportunities. Understanding how these markets operate is crucial for employing volatility indicators effectively.
Trading Indices
A trading index represents the performance of a group of assets, typically a basket of stocks, that mirror a particular sector, region, or the overall economy. These indices allow traders to speculate on the performance of entire markets rather than individual stocks. Some of the most well-known indices include:
- S&P 500: Comprising 500 of the largest publicly traded companies in the U.S., this index is considered a key indicator of overall market performance (Example: Apple Inc. (AAPL).
- Dow Jones Industrial Average (DJIA): This index tracks 30 large, publicly-owned companies based in the United States, representing sectors such as technology, energy, and consumer goods (Example: The Coca-Cola Company (KO) .
- NASDAQ 100: This index focuses on the 100 largest non-financial companies listed on the NASDAQ stock exchange, emphasizing the tech sector (Example: Alphabet Inc. (GOOGL).
- FTSE 100: Composed of the 100 largest companies listed on the London Stock Exchange, the FTSE 100 is a benchmark for the UK economy (Example: BP plc (BP).
Indices trading is popular among traders because it allows them to gain broad market exposure without having to buy individual stocks. By tracking the collective movements of numerous stocks, indices provide a snapshot of market sentiment, making them valuable for understanding macroeconomic trends.
How Do Volatility Indicators Apply to Indices Trading?
In indices trading, volatility indicators are used to assess market conditions and predict future price movements. Indices can experience periods of high volatility during major economic events, earnings seasons, or geopolitical developments. For example, a sudden increase in volatility may signal uncertainty or a shift in market sentiment, prompting traders to adjust their positions accordingly. Similarly, low volatility in an index can indicate that the market is in a consolidation phase, allowing traders to wait for a breakout before taking action.
Using volatility indicators in indices trading helps traders gauge the risk associated with entering or exiting trades, manage their portfolio’s exposure to market fluctuations, and time their trades based on changes in volatility. For example, during periods of rising volatility, traders may reduce their exposure to riskier assets or employ hedging strategies.
FOREX (Foreign Exchange) Market
The FOREX market refers to the global decentralized market where currencies are traded. This market operates 24 hours a day, five days a week, and is the largest and most liquid financial market in the world, with a daily trading volume exceeding $6 trillion. Currencies are traded in pairs, such as EUR/USD (Euro/US Dollar), GBP/JPY (British Pound/Japanese Yen), or USD/JPY (US Dollar/Japanese Yen).
The value of one currency in relation to another fluctuates based on various factors, including:
- Monetary Policy: Central bank decisions on interest rates can significantly affect currency values. For instance, a rate hike can make a currency more attractive to investors, driving up its value.
- Geopolitical Events: Political instability or conflicts can lead to sharp movements in currency prices as traders react to perceived risks or opportunities.
- Economic Data: Key data releases, such as GDP growth rates, employment figures, or inflation numbers, can have an immediate impact on currency exchange rates.
Volatility Indicators in LightningChart JS Trader Charts
In LightningChart JS Trader, these tools are often visualized through advanced charting capabilities, allowing traders to monitor both indices and FOREX markets in real-time. The platform’s high-performance charts are ideal for applying complex volatility indicators and tracking dynamic price movements in fast-moving markets. Traders can overlay different volatility indicators on their charts to identify trends, breakouts, and potential reversals in both indices and forex trading.
Volatility indicators in LC JS Trader charts provide essential real-time data that traders can use to adjust their strategies dynamically. Whether trading indices or FOREX, real-time charting tools help in visualizing key metrics, including price volatility, trend strength, and potential reversal points. The ability to integrate multiple indicators into LC JS Trader charts also allows traders to develop more sophisticated, data-driven trading strategies.
Here’s a brief overview of seven important Volatility Indicators, often used in LightningChart JS Trader charts:

1. Average True Range (ATR): ATR measures market volatility by calculating the average range between the high and low prices over a specific period. It helps traders assess the potential risk and volatility in the market. How it’s used in technical analysis:
- Risk management: ATR is commonly used to set stop-loss levels. For instance, a trader might set their stop-loss at 1.5 times the current ATR value below their entry point. This ensures that the stop-loss adapts to current market conditions.
- Identifying breakouts: An increase in ATR values suggests higher volatility, which often precedes breakouts in price. When prices move sharply above or below a recent trading range while ATR rises, traders might interpret it as a sign of a potential new trend.
Example in LC Trader charts: A trader analyzing Alphabet Inc. (GOOGL) might notice that the Average True Range (ATR) is rising while the price moves sharply higher. This could indicate that Alphabet’s stock is experiencing heightened volatility, signaling the potential for a continuation of the current trend. Traders could use this information to adjust their stop-loss levels or look for opportunities to enter or exit their positions based on volatility signals.

2. Chaikin Volatility (CV): This indicator compares the difference between a stock’s high and low prices over a set period, measuring price volatility. It helps traders identify periods of increased or decreased price volatility in an asset. How it’s used in technical analysis:
- Trend confirmation: When volatility rises and prices are trending upwards, traders might use it as a confirmation that the current bullish trend is likely to continue. Conversely, falling volatility in a downtrend could indicate weakening bearish momentum.
- Divergence spotting: Traders use Chaikin Volatility to identify divergences between price movement and volatility. If prices are rising, but volatility is decreasing, it might suggest that the uptrend is losing steam and a reversal could be imminent.
Example in LC Trader charts: A trader examining Alphabet Inc. (GOOGL) may notice that while the stock price is steadily climbing, the Chaikin Volatility indicator shows a drop in volatility. This divergence, rising prices but falling volatility, could indicate that the upward trend is weakening, and the trader might prepare for a potential reversal. Conversely, if the CV rises while the stock price is increasing, it may signal that the current trend has strong momentum and could continue.

3. Ehler Fisher Transform (EFT): EFT normalizes price movements over a period, making it easier to spot potential turning points and price reversals. It is particularly useful for identifying sharp changes in market direction. How it’s used in technical analysis:
- Identifying trend reversals: EFT helps traders identify major reversals in price trends by transforming price data into a Gaussian distribution. When the EFT crosses above a certain threshold (such as 1.5 or -1.5), it may indicate a reversal is near.
- Oscillator trading: Traders use the EFT as an oscillator. When the Fisher Transform crosses above zero, it is a signal to buy, and when it crosses below zero, it signals a potential selling opportunity.
Example in LC Trader charts: When analyzing Alphabet Inc. (GOOGL), a trader might observe that the Ehler-Fisher Transform (EFT) crosses above the zero line, signaling a potential bullish reversal. This would be an indication for the trader to consider entering a long position. Conversely, if the EFT crosses below zero, it could signal the beginning of a bearish phase, prompting the trader to consider a short position or exit an existing long trade.

4. High Minus Low (HML): HML tracks the range between the highest and lowest prices during a given period. It’s a simple measure of price volatility, allowing traders to detect potential breakouts or breakdowns. How it’s used in technical analysis:
- Spotting breakouts: Sudden expansions in the range between high and low prices can indicate the start of a new trend or market phase. Traders use this expansion as a signal to prepare for potential breakouts.
- Volatility timing: Traders use HML to understand when volatility is expanding or contracting. A low, stable HML reading followed by a sudden expansion can indicate an impending price move, giving traders the chance to position themselves early.
Example in LC Trader charts: A trader following Alphabet Inc. (GOOGL) may notice that the High Minus Low (HML) indicator is expanding significantly, showing an increase in the range between the stock’s high and low prices. This expansion suggests increased volatility and could signal a potential breakout or breakdown, depending on the direction of the price movement. The trader might use this as a signal to prepare for a significant price move in either direction.

5. Historical Volatility Index (HVI): HVI calculates the annualized volatility level of asset returns over a period. This helps in forecasting future price movements based on historical volatility patterns. How it’s used in technical analysis:
- Volatility forecasting: Traders can use historical volatility to predict future price movements, especially when combined with other indicators. If historical volatility is high, it may suggest that the asset is likely to experience more significant price swings in the near term.
- Option pricing: HVI is also used to price options, as the potential for large price movements (as indicated by high historical volatility) increases the value of an option.
Example in LC Trader charts: While reviewing Alphabet Inc. (GOOGL), a trader could see that the Historical Volatility Index (HVI) is rising, indicating that the stock has experienced increased volatility over the past few weeks. This could suggest that the stock is more likely to experience larger price swings in the near future. The trader might adjust their strategy by widening stop-loss orders or hedging positions to mitigate potential risk caused by high volatility.

6. Mass Index: This indicator detects potential trend reversals by analyzing the range between high and low prices over time. It helps traders determine when a trend might reverse, providing early warning signals. How it’s used in technical analysis:
- Reversal detection: When the Mass Index rises above a certain threshold (typically 27), it signals a potential trend reversal. The indicator doesn’t provide a direction (bullish or bearish), but it alerts traders that a significant change in trend may occur soon.
- Divergence spotting: Traders also use the Mass Index to detect divergences between price movements and the indicator itself. Divergences often signal that the current trend is weakening, and a reversal is likely.
Example in LC Trader charts: Suppose a trader is monitoring Alphabet Inc. (GOOGL) and notices that the Mass Index has crossed above the key level of 27. This could signal that a trend reversal is likely, though the direction of the reversal is unclear. The trader may look for additional confirmation from other indicators, such as moving averages or momentum indicators, before making a trade. For example, if the price had been trending upward, the Mass Index crossing 27 could suggest a potential bearish reversal.

7. Z-Value (Z-Score): The Z-Value measures how far a current price is from the mean price, expressed in terms of standard deviations. This helps traders assess whether an asset is overbought or oversold, indicating potential price corrections. How it’s used in technical analysis:
- Overbought/Oversold Conditions: When the Z-value is significantly positive, it suggests that the asset may be overbought, potentially signaling a forthcoming price correction. Conversely, a highly negative Z-value indicates oversold conditions, which could lead to a price rebound.
- Trend Strength: Z-Value helps traders determine the relative strength of price movements. High positive or negative Z-Scores show a strong deviation from the average, often indicating that a trend is strengthening.
- Example in LC Trader charts: When analyzing Alphabet Inc. (GOOGL), a trader might observe that the Z-Value is well above 2, suggesting that the stock is overbought compared to its historical average. This could indicate that a pullback or price correction is imminent. On the other hand, if the Z-value drops below -2, it could imply that the stock is oversold, providing a potential buying opportunity. Traders could use this data to time their entries and exits, anticipating a price movement toward the mean.

The Role of LightningChart JS Trader in Financial Analysis

Financial analysis involves examining historical data to forecast future trends, make informed decisions, and assess risk. In this domain, applications like LightningChart JS Trader serve a critical role by providing real-time, high-performance data visualization tools that help traders and analysts better interpret complex datasets. It enables traders to track market trends using built-in indicators.
The platform’s ability to handle large datasets and real-time updates makes it essential for fast decision-making in dynamic markets. Additionally, its customization options allow users to create tailored charts and apply statistical indicators, enhancing both the precision of analysis and risk management. This tool helps streamline financial analysis and supports more informed, data-driven trading strategies.
How Volatility Indicators Apply to FOREX Trading
In the FOREX market, volatility indicators are invaluable tools for navigating the fast-moving currency pairs. Given the complex nature of currency price movements, driven by factors like interest rate differentials, international trade flows, and geopolitical events, forex volatility indicators help traders assess the risk of sharp price swings. These indicators provide insight into when the market is likely to experience heightened activity or when it may be entering a phase of relative calm.
Volatility in FOREX can differ significantly depending on the currency pair being traded. For example, major pairs like EUR/USD may exhibit lower volatility due to their high liquidity, while exotic pairs like USD/TRY (US Dollar/Turkish Lira) can experience sharp price swings due to lower liquidity and higher geopolitical risk.
Traders use forex volatility indicators to:
- Identify the best time to trade: High volatility often correlates with increased trading opportunities, as price movements are more pronounced. Conversely, during low-volatility periods, traders may opt to wait for clearer market signals.
- Manage risk: Volatility indicators can warn traders of potentially unstable market conditions. By assessing volatility, traders can determine the size of their positions and adjust stop-loss orders to protect their capital in case of adverse market movements.
- Timing entry and exit points: Volatility indicators can help traders identify periods of high volatility that may signal potential breakouts or breakdowns, making it easier to time trades effectively.
For instance, during times of heightened volatility, such as around central bank meetings or major geopolitical events, forex volatility indicators can help traders anticipate sharp moves in currency pairs and position themselves to take advantage of these fluctuations. On the other hand, during quiet market conditions, when volatility indicators show low levels of price movement, traders may adjust their strategies to focus on range-bound trading or wait for clearer directional signals.
How to Create the Volatility Indicators Using LightningChart JS Trader
Step 1: Get LightningChart JS Trader
To begin, you’ll need access to LightningChart JS Trader. This library provides the tools necessary to create advanced technical indicators, including Volatility Indicators. Visit the LightningChart JS Trader page to download the required components and documentation.
Step 2: Review the Interactive Example
LightningChart JS Trader includes interactive examples that demonstrate how to create custom technical indicators. Start by reviewing the documentation, focusing on how to integrate the Volatility Indicators into your chart setup. The interactive examples will guide you through the process of setting up the Volatility Indicators, from importing the necessary modules to modifying the chart settings.
Step 3: Code Explanation
In this step, we will break down the code that creates the chart with the Volatility Indicators, as shown in the image, using LightningChart JS Trader. The code demonstrates how to initialize a trading chart, apply different Volatility Indicators, and customize their appearance.

Here’s a detailed breakdown of each section:
A. Importing the Required Libraries:
   const lcjsTrader = require('@arction/lcjs-trader')
   const lcjs = require('@arction/lcjs')
const { Themes } = lcjs- lcjsTrader: This library provides access to the LightningChart JS Trader functionalities, allowing you to create advanced financial charts.
- lcjs: The main LightningChart JS library is used for general charting functionality.
- Themes: A property within lcjs that provides access to pre-built themes. In this case, we are using the
darkGoldtheme to style the chart.
B. Initializing the Trading Chart:
lcjsTrader.trader(TRADER_LICENSE).then(async (trader) => {
    // Create a trading chart.
const tradingChart = trader.tradingChart({ loadFromStorage: false, colorTheme: Themes.darkGold })- trader(TRADER_LICENSE): Initializes the LightningChart JS Trader with the provided license key (TRADER_LICENSE). This is required to access the charting functionalities for financial data.
Note you can request a LightningChart JS Trader trial license, which is free.
tradingChart(): This function creates a trading chart with certain options. In this example:
loadFromStorage: false: This disables the loading of previously stored chart data from local storage, ensuring a fresh chart setup.colorTheme: Themes.darkGold: This applies the darkGold theme to the chart which influences the background color, grid lines, and other visual elements.
C. Adding and Customizing the Average True Range Indicator
// Add an Average True Range indicator
    const atr14 = tradingChart.indicators().addAverageTrueRange()
    atr14.setPeriodCount(14)
    atr14.setLineWidth(3)
atr14.setLineColor('#FFFF00')addAverageTrueRange(): This function adds the Average True Range (ATR) indicator to the trading chart. ATR is a volatility indicator that measures the average range between high and low prices over a specified period. It helps traders assess market volatility and make more informed decisions about potential price movements and risk levels.setPeriodCount(14): This sets the period count of the ATR indicator to 14, meaning that the ATR will be calculated using the price data from the last 14 periods (typically days in daily charts). A period count of 14 is a common default setting used to capture medium-term volatility.setLineWidth(3): This increases the thickness of the line representing the ATR to 3 pixels, making it more prominent and easier to view on the chart. Thicker lines help distinguish important indicators from other chart elements, enhancing the clarity of the volatility data.setLineColor('#FFFF00'): This changes the color of the ATR line to yellow (#FFFF00). The yellow color ensures the ATR line stands out against the other elements on the chart, allowing traders to quickly assess volatility levels at a glance.
D. Adding and Customizing another Volatility Indicator as an example
// Adding another Volatility indicator

    const mi25 = tradingChart.indicators().addMassIndex()
    mi25.setPeriodCount(25)
    mi25.setLineColor('#FFFFFF')
mi25.setLineWidth(3)addMassIndex(): This function adds the Mass Index indicator to the trading chart. The Mass Index is a volatility indicator that helps detect potential trend reversals by analyzing the range between high and low prices over a set period. Unlike other indicators, it doesn’t indicate the direction of the trend but signals that a reversal might be near when a threshold is crossed.setPeriodCount(25): This sets the period count of the Mass Index indicator to 25, meaning that the Mass Index will be calculated based on the high and low prices over the last 25 periods (e.g., days in a daily chart). A 25-period Mass Index is typically used to give traders a view of longer-term volatility and potential trend changes.setLineColor('#FFFFFF'): This sets the color of the Mass Index line to white (#FFFFFF). The white color ensures that the Mass Index line is visible against the chart’s background and other elements, making it easy for traders to track and identify key signals.setLineWidth(3): This increases the thickness of the Mass Index line to 3 pixels. The thicker line improves visibility on the chart, helping traders easily spot the Mass Index indicator and focus on important points where trend reversals might occur.
E. Loading Data from a CSV File
    // Reading data from a file.
    await fetch(`${document.head.baseURI}examples/assets/0000/Alphabet Inc (GOOGL).csv`).then((res) => res.text()).then((text) => {
        tradingChart.readCsvString(text, 'Alphabet Inc (GOOGL)')
})fetch(): This function retrieves a CSV file containing historical data for Alphabet Inc. (GOOGL). The CSV file includes pricing information for the company’s stock, which is plotted on the chart.readCsvString(): This function reads the CSV data and interprets it as pricing data for Alphabet Inc. The second argument (‘Alphabet Inc (GOOGL)’) sets the label for the chart, as seen at the top of the chart image.
F. Setting the Currency for the Chart
    tradingChart.setCurrency('USD')
})setCurrency('USD'): This sets the currency of the chart to USD, ensuring that the pricing data is interpreted and displayed in US dollars.
Advantages and Limitations of Volatility Indicators
Advantages
- Risk Management: Volatility indicators help traders manage risk by providing insight into potential price swings.
- Early Signals: These indicators can offer early signals for potential price movements, enabling traders to act promptly.
- Trend Identification: Volatility indicators assist in confirming the strength of a trend, making them vital tools for trend-following strategies.
Limitations:
- Lagging Nature: Many volatility indicators are lagging, meaning they react to price movements rather than predict them.
- False Signals: In periods of market noise or choppiness, volatility indicators may generate false signals, leading to poor decision-making.
- Dependence on Market Conditions: Volatility indicators are less effective in low-volatility markets, where price fluctuations are minimal.
Conclusion
Volatility indicators are essential tools for any trader looking to analyze market fluctuations and optimize trading strategies. From the forex market to trading indices, these indicators provide valuable insights into market conditions and price movements, helping traders make informed decisions. While they come with certain limitations, when used correctly, they can significantly enhance your trading performance.
The integration of volatility indicators like ATR, Chaikin Volatility, Mass Index, and Z-Value into platforms such as LightningChart JS Trading charts enhances the analysis process by offering real-time visualizations and advanced customization options. LightningChart JS Trader enables traders to seamlessly overlay these indicators on charts, customize their appearance, and visualize market volatility more clearly and efficiently. With features such as line color adjustments, period settings, and thickness options, LightningChart JS Trader ensures that critical indicators stand out, providing traders with the clarity needed to navigate complex markets.
Key Takeaways:
- Volatility indicators measure price fluctuations, helping traders assess market sentiment and risk.
- These indicators are widely used in both FOREX and trading volatility indices.
- LC JS Trader charts play an important role in visualizing and customizing volatility indicators, enabling traders to fine-tune their analysis and make data-driven decisions in real-time.
- Combining multiple volatility indicators on LC JS Trader charts allows traders to develop more refined strategies and improve their ability to manage risk and time market entries/exits effectively.
By using LightningChart JS Trader charts, traders gain access to cutting-edge tools for monitoring market dynamics, improving decision-making, and optimizing their trading strategies. This platform supports a sophisticated approach to volatility analysis, empowering users to identify key market trends and manage risk with greater precision.

Ahmad Omid
Data Science Developer
Continue learning with LightningChart
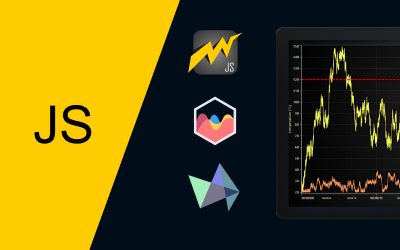
Chart.js vs Highcharts vs LightningChart – Which Should You Choose?
If you've been searching for a JavaScript charting library, you already know the problem: comparison articles tend to list features and stop there. Nobody tells you what actually happens at 500,000 data points, or what a Highcharts license costs a team of ten...

7 Best FusionCharts Alternatives in 2026: Faster, Cheaper, More Capable
FusionCharts has been in enterprise JavaScript charting since the early 2000s and built a genuinely broad product, 90+ chart types, over 1,000 interactive maps, multi-language support that most competitors don't come close to matching, and a track record with over...

Best DevExpress Charts Alternative in 2026: GPU Performance for Web and Desktop
DevExpress is one of the most comprehensive UI component suites in the .NET and web ecosystem. WinForms, WPF, ASP.NET, Blazor, JavaScript it covers the full Microsoft-aligned development stack with grids, schedulers, form components, reporting, and charting all...


If you have any questions, feel free to contact us!
©LightningChart Ltd 2026. All rights reserved.