


Learn how to use Skewness in Trading for technical analysis app development
Article
Assisted by AI
Learn how to use skewness in trading to integrate it into your trading software applications using LightningChart JS Trader.
Ahmad Omid
Data Science Developer

Introduction to Skewness in Trading
Skewness in trading refers to the degree of asymmetry observed in the distribution of asset returns or prices. In simpler terms, it helps traders understand whether the tail of the distribution is heavier on one side, either left (negative skew) or right (positive skew). This matters because extreme events, sharp gains or steep losses, can significantly influence outcomes in financial markets.
Skewness in trading is crucial in technical analysis because it adds depth beyond standard metrics like mean or standard deviation. Where volatility tells you how much a price moves, skewness tells you the shape of those moves, whether crashes are more likely than rallies or vice versa.
Understanding skewness in trading allows traders to better assess the risk profile of a market. A negatively skewed asset implies more frequent small gains and a few extreme losses, common in overbought markets. A positively skewed asset, on the other hand, might see more frequent small losses but the potential for occasional large gains.
Positive skewness suggests that the tail is on the right side, meaning there’s a chance of sudden, strong upside moves. This can appeal to trend followers and breakout traders. Negative skewness, with its left-tail distribution, may signal lurking risks, valuable insight for risk-averse or contrarian traders.
By incorporating skewness in trading, technical analysts can gain a more nuanced view of price behavior, particularly when combined with other indicators.
Skewness in Options Trading
In options markets, skewness manifests as volatility skew—a phenomenon where implied volatility differs between out-of-the-money (OTM), at-the-money (ATM), and in-the-money (ITM) options.
Typically, volatility skew shows up when put options have higher implied volatility than call options. This results in a negative skew, indicating that traders are pricing in greater potential for downside moves. This behavior is common in equity markets where investors seek protection against crashes.
Several factors influence volatility skew, including:
- Demand and supply: If more traders are buying puts for protection, their premiums rise, increasing the skew.
- Market sentiment: Fearful or bearish sentiment often causes negative skewness, while bullish expectations may create a flatter or even positive skew.
- Event risk: Upcoming earnings reports, policy decisions, or geopolitical tensions can drive skew as traders adjust their positions.
Understanding the skew in options pricing helps traders interpret how the broader market is pricing risk, especially extreme events. It’s an essential component when using skewness in trading strategies, especially for hedging or exploiting mispriced options.
Formula
Skewness in trading tells us whether the price data leans more toward big gains or big losses. Here’s the simplified idea behind the formula.

where:
- Xi = each data point (price).
- x̄ = the mean (average) of the prices.
- N = total number of data points
- σ = standard deviation
- The third power (cube) in the formula exaggerates the effect of outliers (those big moves).
In the formula, dividing by the cube of the standard deviation helps scale the result so it’s not just a random number.
Interpretation
- Skewness = 0 → The price distribution is balanced (rare in real markets).
- Skewness > 0 → More chances of big upward moves (positive skew).
- Skewness < 0 → More chances of sharp drops (negative skew).
Calculation Example
Let’s say you’re looking at five daily closing prices of a stock:
- Prices: 98, 100, 101, 102, 120
- Mean (average): 104.2
- Standard Deviation: ~8.5
Calculation Interpretation:
- Most prices are close to the mean, but 120 is a big jump, that’s your outlier.
- When we cube the differences and apply the formula, we get a positive skew.
- This tells you the distribution has a longer tail to the right, potential for big upward moves.
Understanding skewness in trading becomes practical when you can see it in action on charts, especially when combined with volatility or price trends. Moreover, you don’t need to crunch these numbers by hand. With LightningChart JS Trader, you can automate the calculations, plot skewness in real time, and easily adjust parameters like lookback period.
How to Create the Technical Indicator Using LC JS Trader
Step 1: Get LightningChart JS Trader
To begin, you’ll need access to LightningChart JS Trader. This library provides the tools necessary to create advanced technical indicators, including the Skewness Indicator. Visit the LightningChart JS Trader page to download the required components and review the documentation.
Step 2: Review the Interactive Example
LightningChart JS Trader includes interactive examples that demonstrate how to create custom technical indicators. Start by reviewing the documentation, focusing on how to integrate the Skewness Indicator into your chart setup. The interactive examples will guide you through the process of setting up the Skewness Indicator, from importing the necessary modules to modify the chart settings.
Step 3: Code Explanation
In this step, we will break down the code that creates the chart with the Skewness Indicator, as shown in the image, using LightningChart JS Trader. The code demonstrates how to initialize a trading chart, apply the Skewness Indicator, and customize its appearance.

Here’s a detailed breakdown of each section:
A. Importing the Required Libraries:
   const lcjsTrader = require('@arction/lcjs-trader')
   const lcjs = require('@arction/lcjs')
const { Themes } = lcjs- lcjsTrader: This library provides access to the LightningChart JS Trader functionalities, allowing you to create advanced financial charts.
- lcjs: The main LightningChart JS library, used for general charting functionality.
- Themes: A property within lcjs that provides access to pre-built themes. In this case, we are using the darkGold theme to style the chart.
B. Initializing the Trading Chart:
   lcjsTrader.trader(TRADER_LICENSE).then(async (trader) => {
    // Create a trading chart.
const tradingChart = trader.tradingChart({ loadFromStorage: false, colorTheme: Themes.darkGold })trader(TRADER_LICENSE): Initializes the LightningChart JS Trader with the provided license key (TRADER_LICENSE). This is required to access the charting functionalities for financial data.
Note you can request a LightningChart JS Trader trial license, which is free.
tradingChart(): This function creates a trading chart with certain options.loadFromStorage: false: This disables the loading of previously stored chart data from local storage, ensuring a fresh chart setup.colorTheme: Themes.darkGold: This applies the darkGold theme to the chart, which influences the background color, gridlines, and other visual elements.
C. Adding and Customizing the Indicator
    // Add a Kurtosis Indicator
    const ku = tradingChart.indicators().addKurtosis()
    ku.setPeriodCount(20)
    ku.setMovingAverageType(1)
    ku.setSource(3)
    ku.setLineColor('#E8DB54')
ku.setLineWidth(3)addSkewness():It measures the asymmetry of the probability distribution of the price giving information about the extremes of the data set.
sk.setPeriodCount(20): Sets the number of time periods (n) used to calculate the indicator.
**sk.setMovingAverageType(1): Sets the type of Moving Average used in Skewness calculations. In this case, 1 represents none, but it is possible to change it using different moving averages.
***sk.setSource(3): Sets which values the indicator calculations are based on. In this case, 3 represents the Close value.
setLineColor('#F53D29’): Sets the color of the indicator line to red.
sk.setLineWidth(3): Sets the width of the indicator line to 3 pixels.
D. Loading Data from a CSV File
    // Reading data from a file.
    await fetch(`${document.head.baseURI}examples/assets/0000/Alphabet Inc (GOOGL).csv`).then((res) => res.text()).then((text) => {
        tradingChart.readCsvString(text, 'Alphabet Inc (GOOGL)')
})fetch(): This function retrieves a CSV file containing historical data for Alphabet Inc. (GOOGL). The CSV file includes pricing information for the company’s stock, which is plotted on the chart.readCsvString(): This function reads the CSV data and interprets it as pricing data for Alphabet Inc. The second argument (‘Alphabet Inc (GOOGL)’) sets the label for the chart, as seen at the top of the chart image.
E. Setting the Currency for the Chart
    tradingChart.setCurrency('USD')
})setCurrency('USD'): This sets the currency of the chart to USD, ensuring that the pricing data is interpreted and displayed in US dollars.
** Enumeration of Moving Average Types in LC JS Trader:
- Exponential Moving Average (EMA): 0
- None: 1 (No moving average applied)
- Simple Moving Average (SMA): 2
- Time Series Moving Average (TSMA): 3
- Triangular Moving Average (TMA): 4
- Variable Moving Average (VMA): 5
- Variable Index Dynamic Average (VIDYA): 6
- Volume Weighted Moving Average (VWMA): 7
- Weighted Moving Average (WMA): 8
- Welles Wilder’s Smoothing (WWS): 9
*** Enumeration Source in LC JS Trader:
To select which values the indicator calculations are based on.

Advantages and Limitations of the Indicator
One of the key advantages of using skewness in trading is its ability to highlight asymmetry in price behavior, something standard indicators like volatility or moving averages often miss. Skewness gives traders insight into the likelihood of extreme outcomes on either side of the distribution.
For example, a negative skew might reveal a market with hidden downside risk, while a positive skew could signal potential for large upside moves. This makes skewness especially useful for traders who want to assess risk more precisely or fine-tune their strategy based on the nature of price movements.
Another benefit is that skewness can complement other technical indicators. When combined with tools like Bollinger Bands, RSI, or volume analysis, skewness helps provide a more complete picture of market dynamics. It also plays a vital role in options trading, where volatility skew helps interpret market sentiment and adjust hedging or speculative positions.
However, skewness isn’t without its limitations. The indicator can be sensitive to outliers and small data sets, which may lead to misleading signals if not interpreted carefully.
A few extreme price points can heavily influence the result, making it appear that a market has more risk or opportunity than it really does. Also, skewness is inherently a lagging indicator, it reflects what has happened, not necessarily what will happen. That means traders need to use it in context, not as a standalone trigger for entry or exit.
Despite these limitations, skewness remains a powerful addition to a trader’s toolbox, especially when visualized and calculated using environments like LightningChart JS Trader, which allow for real-time interaction and deeper exploration of historical price patterns.
Conclusion
Skewness in trading offers valuable insights into market behavior by revealing whether extreme price movements are more likely to occur on the upside or downside. It’s especially useful for assessing risk and understanding market sentiment, both in price data and in options pricing through volatility skew.
Using LightningChart JS Trader, traders can build and customize skewness indicators interactively, analyze price distributions visually, and spot patterns that traditional indicators might miss. By integrating skewness into your technical analysis toolkit, you gain a deeper perspective on market dynamics, one that can help you manage risk more effectively and capitalize on asymmetric opportunities.
Continue learning with LightningChart
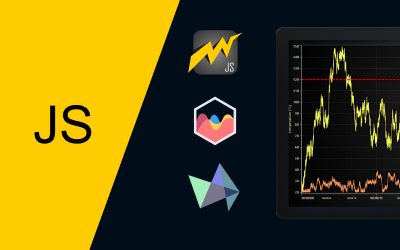
Chart.js vs Highcharts vs LightningChart – Which Should You Choose?
If you've been searching for a JavaScript charting library, you already know the problem: comparison articles tend to list features and stop there. Nobody tells you what actually happens at 500,000 data points, or what a Highcharts license costs a team of ten...

7 Best FusionCharts Alternatives in 2026: Faster, Cheaper, More Capable
FusionCharts has been in enterprise JavaScript charting since the early 2000s and built a genuinely broad product, 90+ chart types, over 1,000 interactive maps, multi-language support that most competitors don't come close to matching, and a track record with over...

Best DevExpress Charts Alternative in 2026: GPU Performance for Web and Desktop
DevExpress is one of the most comprehensive UI component suites in the .NET and web ecosystem. WinForms, WPF, ASP.NET, Blazor, JavaScript it covers the full Microsoft-aligned development stack with grids, schedulers, form components, reporting, and charting all...


If you have any questions, feel free to contact us!
©LightningChart Ltd 2026. All rights reserved.