


LightningChart PythonEuro vs Dollar Forecast Application Development
TutorialImplementation of a euro vs dollar forecast application to predict future prices.
Written by a human | Updated on April 23rd, 2025
Euro vs Dollar Forecast Application
Predicting currency exchange rates is crucial for economic stability, investment strategies, and international trade. The Euro vs. Dollar forecast using Python can provide insightful predictions for traders and economists. By leveraging machine learning techniques like Gradient Boosting Regressor (GBR), we can analyze the EUR/USD exchange rate to predict future movements and compare daily versus hourly data forecasts. This article will guide you through the process, using the powerful visualization capabilities of LightningChart Python.
Economic market impact of predicting the currency exchange
Understanding the exchange rate between the Euro and the Dollar is vital for numerous stakeholders:
- Investors need accurate forecasts to make informed decisions.
- Businesses involved in international trade rely on exchange rate predictions to manage risk and optimize profits.
- Governments and central banks monitor exchange rates to formulate monetary policies.
Accurate predictions of the Euro to Dollar exchange rate can lead to better financial planning and risk management. Utilizing Python for this task offers flexibility and robust data analysis capabilities.
Impact of using machine learning in EUR/USD Exchange Rate Analysis
Using machine learning, including Gradient Boosting Regressor (GBR), in EUR/USD exchange rate analysis improves prediction accuracy, handles large datasets, and adapts to market changes. It automates analysis, enhances risk management, uncovers hidden patterns, and provides real-time insights. GBR boosts prediction performance by combining multiple models, making it especially effective for forex analysis.
LightningChart Python
LightningChart is a high-performance data visualization library that provides a wide range of chart types and features, ideal for visualizing complex data sets like those used for euro vs dollar forecast application examples. Its Python version allows developers to create interactive, high-performance visualizations with ease.

Features and chart types to be used in the Project
LightningChart Python offers a variety of chart types, each designed to handle specific types of data visualization needs. In this project, we use the following chart types to visualize euro vs dollar forecast prediction data:
- XY Chart: For visualizing data in two dimensions with series types such as Line Series, Point Line Series, and Area Series.
- Line Series: Ideal for displaying continuous data points connected by straight lines, useful for showing trends over time.
- Bar Chart: Used for visualizing categorical data as bars, making it easy to compare different categories side by side.

Performance Characteristics
LightningChart’s performance is unmatched, handling millions of data points with ease and maintaining smooth user interactions. One of the standout aspects of LightningChart Python is its performance. The library is optimized for handling large volumes of data with minimal latency, which is crucial for financial applications where data needs to be processed and visualized in real time to inform trading decisions.
Setting Up Python Environment
Installing Python and Necessary Libraries
To begin with the euro vs dollar forecast, you need to set up your development environment. Start by installing Python from the official Python website. LightningChart Python requires Python version 3.10 or higher. To get the documentation and the license, please visit LightningChart Python Website. Also, you can visit the GitHub Euro vs Dollar Forecast app development article to get the original source code.
pip install lightningcharts random numpy pandas scikit-learn# Ignoring warnings
import warnings
warnings.simplefilter('ignore')
# Importing necessary modules
import sys
import pandas as pd
import numpy as np
import sklearn
from sklearn.linear_model import LinearRegression, SGDRegressor
from sklearn.svm import SVR
from sklearn.ensemble import BaggingRegressor, RandomForestRegressor, GradientBoostingRegressor
from sklearn.preprocessing import StandardScaler, MinMaxScaler
from sklearn.metrics import mean_squared_error, mean_absolute_error, r2_score
import joblib
from sklearn.model_selection import RandomizedSearchCV, GridSearchCV, train_test_split
from scipy.stats import randint
import xgboost
from xgboost import XGBRegressor, DMatrixOverview of Libraries Used
- LightningChart: For advanced data visualization capabilities.
- NumPy: A fundamental package for numerical computation in Python.
- Pandas: Essential for data manipulation and analysis.
Setting Up Your Development Environment
Recommended IDEs include Jupyter Notebook, PyCharm, or Visual Studio Code.
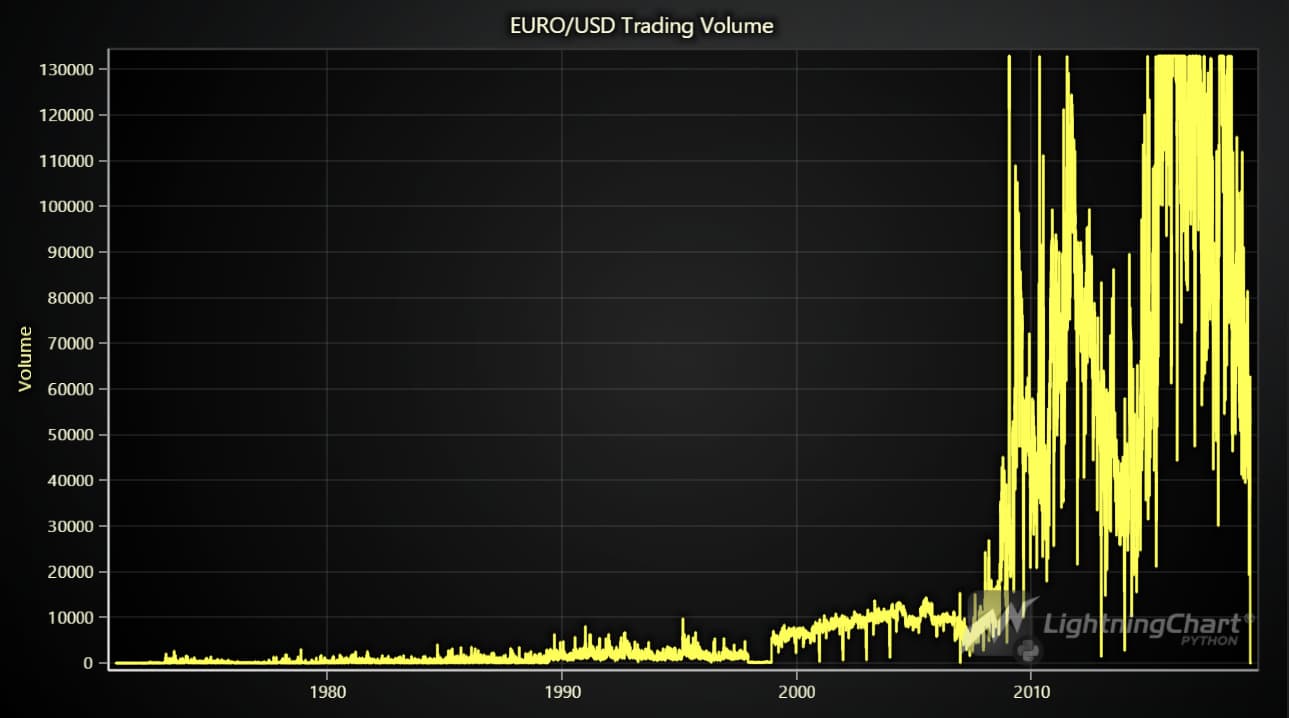
Loading and Processing Data
Euro/Dollar Forex data can be obtained from various sources. For this example, we’ll use a CSV file from Kaggle, the world’s largest data science and machine learning community:
import pandas as pd

# Load the CSV file
eu = pd.read_csv('./eu.csv', parse_dates=True, skipinitialspace=True)
Handling and preprocessing the data
Preprocessing steps may include handling missing values, normalizing data, and feature engineering.
# Strip spaces from column names
eu.columns = eu.columns.str.strip()
# Now, you can safely drop the 'date' column if it's not needed
eu.drop('date', axis='columns', inplace=True)
# Print columns to verify the correction
print(eu.columns)
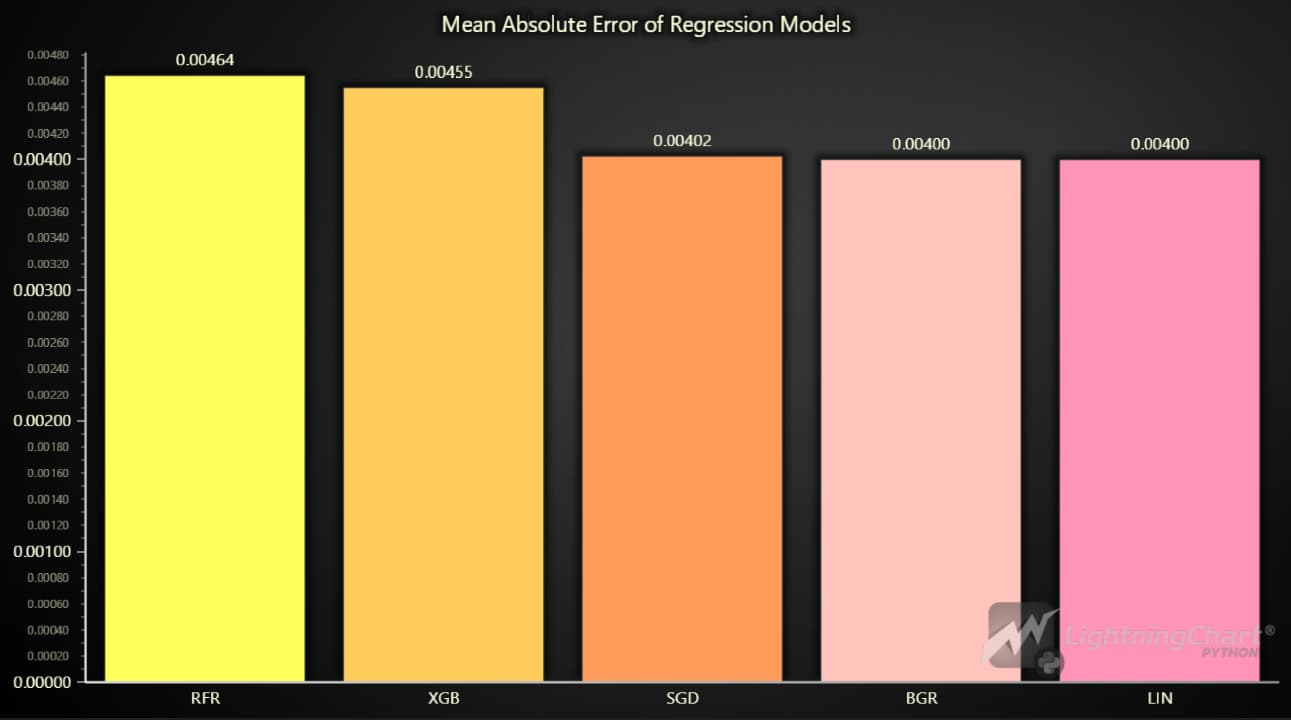
eu.isna().sum()Validation of the study
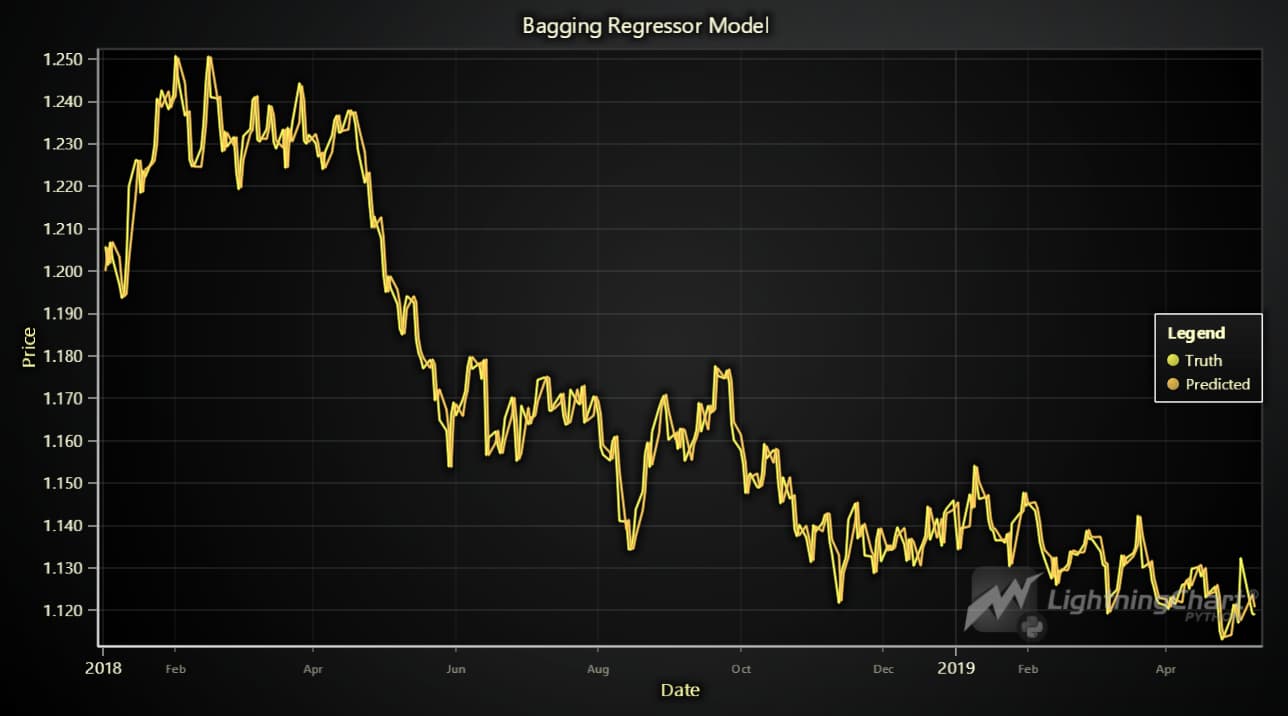
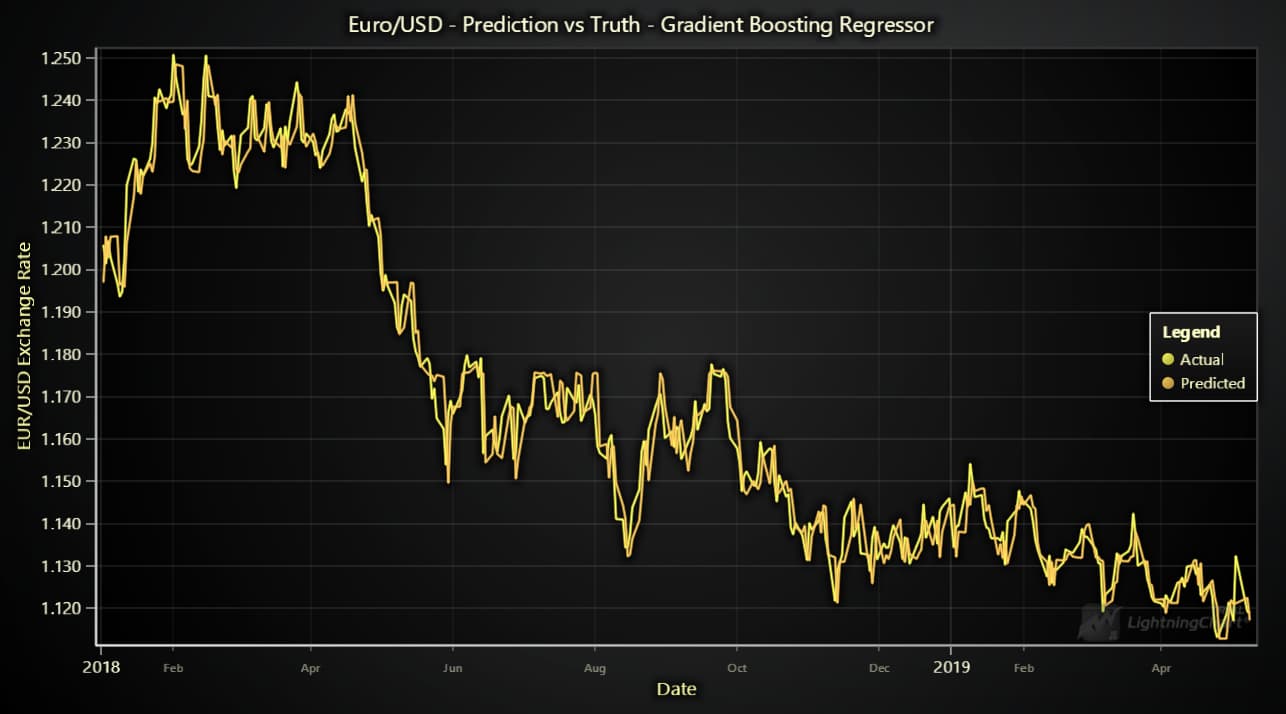
The validation results indicate that the Gradient Boosting Regressor (GBR) performed exceptionally well in predicting the EUR/USD exchange rate:
• RMSE (0.0056): Low prediction error, indicating high accuracy.
• MAE (0.0044): Small average error between predicted and actual values, confirming precise predictions.
• R² (0.9793): High explanatory power, with the model accounting for almost 98% of the variance in the data.
Overall, these metrics demonstrate that the GBR model is highly effective and reliable for forecasting the EUR/USD exchange rate.
Visualizing Data with LightningChart
LightningChart Python allows for the creation of highly interactive and customizable charts. Here are some of the LC charts below:


Creating the charts
To visualize the data, you can create various charts using LightningChart Python:
import lightningchart as lc
import random

# Initialize LightningChart and set the license key
lc.set_license('my-license-key')

# Create a BarChart using LightningChart
chart = lc.ChartXY(title= ' EURO/USD')
Customizing visualizations
LightningChart offers extensive customization options. You can change the theme and colors, add markers, hide or sort some features or integrate real-time data updates to enhance the visualization:
# Initialize the chart
chart = lc.ChartXY(
    theme=lc.Themes.Dark,
    title='EURO/USD'
)

# Get the x and y values from your DataFrame
x_values = eu['timestamp_ms'].tolist()
y_values = eu['close'].tolist()

# Add the time series data to the chart
series = chart.add_line_series().append_samples(
    x_values=x_values,
    y_values=y_values
)
series.set_line_thickness(2)  # Adjust the line thickness as needed

# Open the chart
chart.open()
Conclusion
In this article, we explored the Euro/Dollar forecast using Python and LightningChart. We set up the Python environment, loaded and processed data, and visualized it using LightningChart.
Why is LightningChart Python useful?
Using LightningChart Python for visualizing forex data provides:
- Real-time data processing capabilities.
- High-performance visualization for large datasets.
- Customizable charts that enhance data interpretation.
Benefits of using LightningChart Python for developing a euro vs dollar forecast application?
LightningChart Python is a powerful tool for financial data visualization due to its performance, customization options, and ease of use. It is particularly useful for creating interactive and real-time visualizations that can aid in making informed trading decisions.

Ahmad Omid
Data Science Python Developer
Continue learning with LightningChart

Best OxyPlot Alternative in 2026: GPU Rendering, 3D Charts, Commercial Support
OxyPlot has been a reliable reference point in the .NET scientific and engineering charting space for over a decade. MIT-licensed, platform-neutral in its rendering model (which is how it achieves coverage across WPF, WinForms, Xamarin, Avalonia, and MAUI from a...
7 Best Plotly.js Alternatives in 2026: Faster, Lighter, No Context Limits
Plotly.js holds a unique position in the JavaScript charting ecosystem. Data scientists already know it from Python, when Plotly.py generates a chart in a Jupyter notebook, it's Plotly.js rendering it in the browser. That continuity between languages is genuinely...

7 Best Highcharts Alternatives in 2026: Faster, Cheaper, and More Capable
Highcharts has been a reliable workhorse for enterprise JavaScript charts since 2009. Solid documentation, broad chart type coverage, WCAG accessibility that's genuinely best-in-class. A lot of teams have built a lot of dashboards on it over the years. But teams also...


If you have any questions, feel free to contact us!
©LightningChart Ltd 2026. All rights reserved.