


Blog
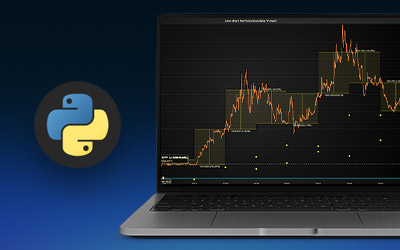
Retail Stock Analysis
Learn how to create a retail stock analysis trading application in Python using LightningChart Python Trader.
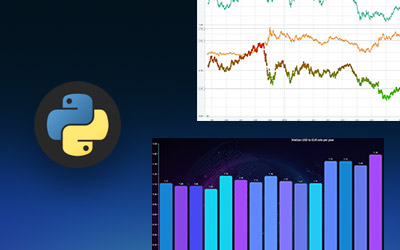
Forex Technical Analysis
Apply forex technical analysis to interpret charts, spot trends, and build smarter Python trading applications.
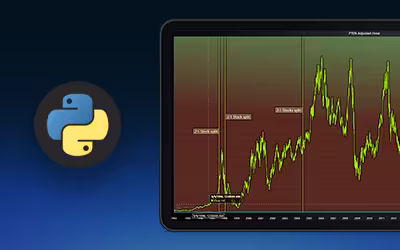
PTEN Market Data Analytics
Discover how LightningChart Python Trader delivers faster, clearer financial analysis through Patterson-UTI Energy’s stock market data visualization.
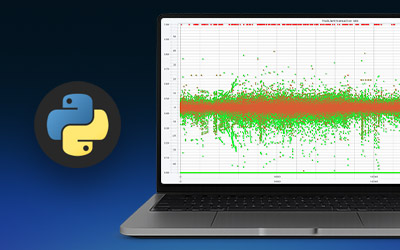
Credit Card Fraud Detection
Learn how to develop a credit card fraud detection analysis using LightningChart Python Trader.

Biotech Stock Analysis
Conducting a biotech stock analysis using LightningChart Python Trader to analyze John & Johnson, Pfizer, and Merck and Company stocks.
Oil and Gas Stock Analysis
Develop an oil and gas stock analysis utilizing LightningChart Python Trader for developing trading applications in Python.

Guide to Technical Indicators
Explore our comprehensive guide to technical indicators to create Python trading applications with LightningChart Python Trader.
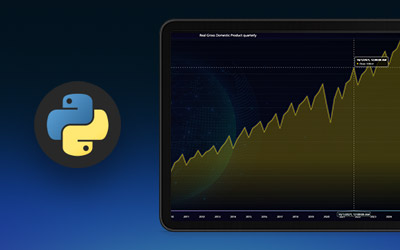
Analyzing Economic Indicators
Discover how LightningChart Python Trader simplifies the process of analyzing economic indicators for better trading decisions.

Visualize Commodity Prices
Learn how to visualize commodity prices using LightningChart Python Trader for advanced trading data visualization techniques.

Visualize Time Series Data for Stock Trading
Learn how to visualize time series data for creating stock trading data analysis Python applications using LightningChart Python Trader library.


If you have any questions, feel free to contact us!
©LightningChart Ltd 2026. All rights reserved.