


LightningChart .NETNbody Simulation Data Visualization
ArticleAn introduction to Nbody simulation data visualization components with LightningChart .NET library
Written by a human | Updated on April 9th, 2025
N-body Simulation
Nbody simulation is maybe one of the most advanced data visualization types out there. The truth is that we’re not talking anymore about visualizing traditional data with a business focus and it goes even beyond data from advanced sources such as vibration analysis.
So, what is an Nbody simulation?
An Nbody simulation is the visual representation of an “n” (number) of particles that adhere to a type of force that makes them interact with each other. The particles are constantly moving in different directions and within a space of time.
So why is Nbody simulation an advanced visualization type?
It is considered an advanced visualization type due to the nature of its application and usage within the research field. For instance, one of its applications is in astrophysics for the simulation of astronomical objects particles, interstellar clouds, and other celestial objects.
What is an Nbody Simulation?
In astrophysics, an Nbody simulation is a visualization of different particles that are attracted to each other due to gravity and electrostatic forces.
Simply put, the electrostatic force is that contained in particles with an electric charge. (The force or electricity that’ll make them attractive to each other).

That is how the purpose of a simulation of the Nbody type is to help to visualize the movement that happens between the bodies (particles) in a time frame and that time can be infinite! So, in the case that an N number of bodies or particles meet, these would exchange electrical activity (energy).
Research Applications & Study Fields
Astrophysics
One of the most common applications is in the field of astrophysics. Nbody simulations help researchers visualize different celestial body formations and understand different events such as galaxies formations. The main application in the field of N simulations is the study of gravitational forces that exists between particles.
Each particle can be the representation of an object within a certain environment (e.g., a universe) and as in a real-life context, these objects can be infinite, there is the complexity of this simulation!
Molecular Dynamics
As part of biology and chemistry, this type of simulation is strongly used for the study of large data sets of particles. A particularly demanding field that requires not only a large rendering capacity but interactivity and the highest performance, as suggested by the Institute for Visualization and Interactive Systems of the University of Stuttgart.
N-body Simulation Examples
Example #1
Perhaps one of the most important examples of a celestial object simulation is in The Millenium Simulation Project which was able to compute and display input of 10^10 data points (in practice, more than 10 billion data points) of how the dark matter is distributed along in the universe.
Simply put, dark matter refers to an intangible object, something that just cannot be seen but astrophysics do know it exists as they can study the consequences and impacts that it has on other celestial objects.
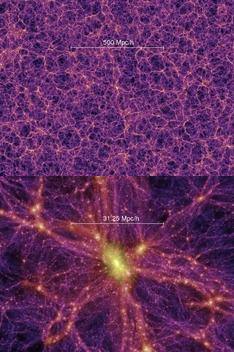
Source. Credit: Springel et al. (Virgo Consortium)
Example #2
Did you ever imagine how the universe looked like when it was only 5% of its current age?
The next example shows a bunch of galaxies and how they were evolving from the beginning of time throughout billions of years. At the beginning of the visualization, you can see the universe when it was only 5% of its actual age.
What you can see at the end of the visualization is a gigantic shockwave that discharges a colossal amount of energy.
Isn’t it interesting to see the interaction of particles that can take the form of bigger, e.g., celestial objects?
Example #3
LightningChart Nbody simulation of 10^3 data points.
This example is included in the LightningChart .NET scientific data visualization library for desktop application development. The visualization displays more than 1,000 data points of different particles reacting to artificial forces.
The bodies within the visualization can be of any type of different physical celestial bodies such as stars, planets, black holes, solar systems, or galaxies.
In the simulation, the gravitational force is that one that seems to attract and repel the particles amongst themselves.
Data Visualization Solutions for Nbody Simulation
As seen, the application of this type of visualization is varied though widely used within astrophysics. Today, there are only a few open-source and even less commercial solutions that can provide such advanced and technically demanding visualization types!
Depending on the visualization library or software, Nbody simulations might experience the limitation of rendering only thousands of data points instead of millions. This happens due to modern computers using only CPU and not GPU to calculate basic arithmetic operations.
With more powerful processors, more data points could be rendered. LightningChart .NET is an advanced data visualization component tailored for integration within desktop applications only for high-performance scientific and advanced data visualizations.
Within LightningChart, you’ll find advanced and the highest-performing data visualizations for advanced purposes such as N-body simulations, LiDar data, ECG for medical applications, Vibration Analysis, financial trading, geography, digital processing, and 170+ chart types!

Karen Cuellar
Digital Marketing Manager
Continue learning with LightningChart

Elliott Wave Theory in Trading
Elliott Wave Theory in TradingFinancial markets often appear chaotic, but many traders believe that price movements follow recurring patterns driven by human psychology. One of the most influential approaches based on this idea is the Elliott Wave Theory. Developed...

The Head and Shoulders Pattern in Technical Analysis
The Head and Shoulders Pattern in Technical Analysis The Head and Shoulders Pattern in Technical Analysis The Head and Shoulders pattern is one of the most recognized and widely used chart patterns in technical analysis. It is considered a reliable reversal pattern...

Best Telerik Charts Alternative in 2026: GPU Performance for WPF, WinForms, and Web
Telerik from Progress is a comprehensive UI component suite covering WPF, WinForms, ASP.NET, Blazor, and JavaScript. The charting components: RadChartView for WPF and WinForms, and Kendo UI Charts for web and Blazor, arrive bundled with the suite purchase. For teams...


If you have any questions, feel free to contact us!
©LightningChart Ltd 2026. All rights reserved.