


Lighting

Introduction
Light Sources
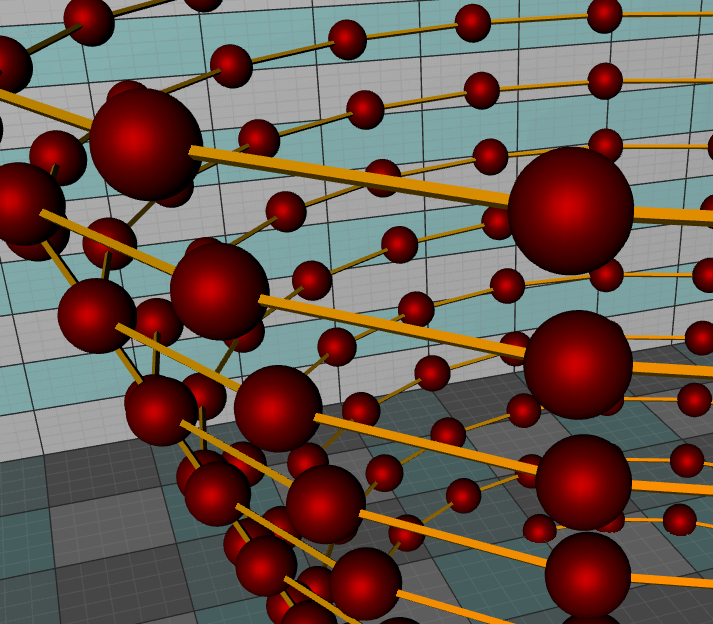
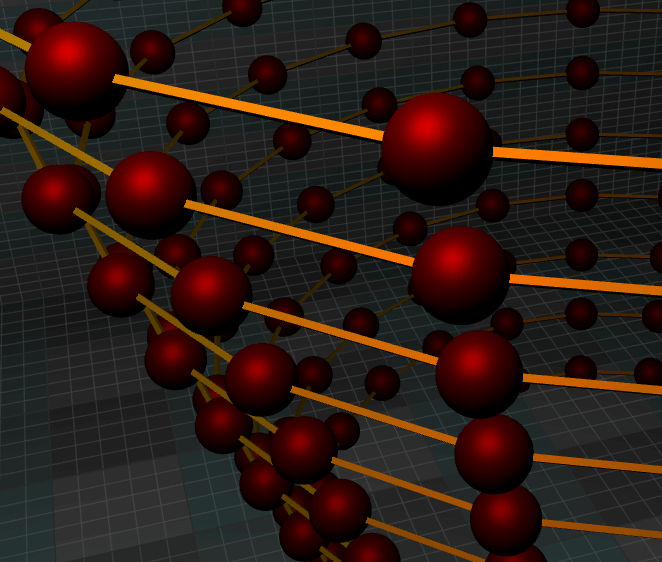
Light and surface interactions
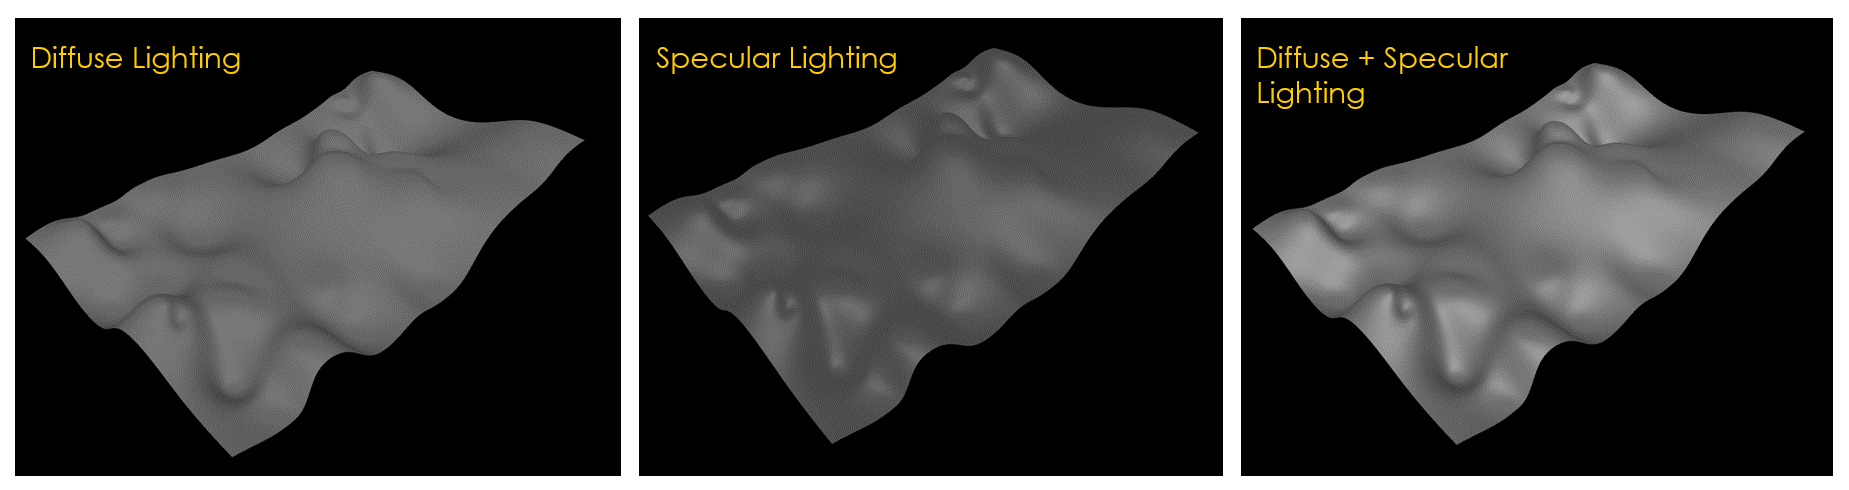
Computation on GPU
Conclusion
javascript candlestick chart
Written by a human | Updated on April 11th, 2025What is a JavaScript Candlestick Chart? A candlestick chart is a type of price chart used in technical analysis, which shows a security's high, low, open, and closing prices over a given time frame. It was...
Sweeping Line Chart for Medical Healthcare
Written by a human | Updated on April 11th, 2025Sweeping Line Chart for Medical Healthcare Hi again, today we'll be creating a Sweeping Line Chart most commonly used in the medical and healthcare industry for displaying changes in a particular variable over time. The...
Angular Bubble Chart
Written by a human | Updated on April 11th, 2025Angular Bubble Chart App Hello there, in this tutorial, we'll use Visual Studio Code and typescript to build a brand-new Angular template from scratch. Also, we'll modify a bubble chart's characteristics to fit the...


If you have any questions, feel free to contact us!
©LightningChart Ltd 2026. All rights reserved.