


Lighting

Introduction
Light Sources
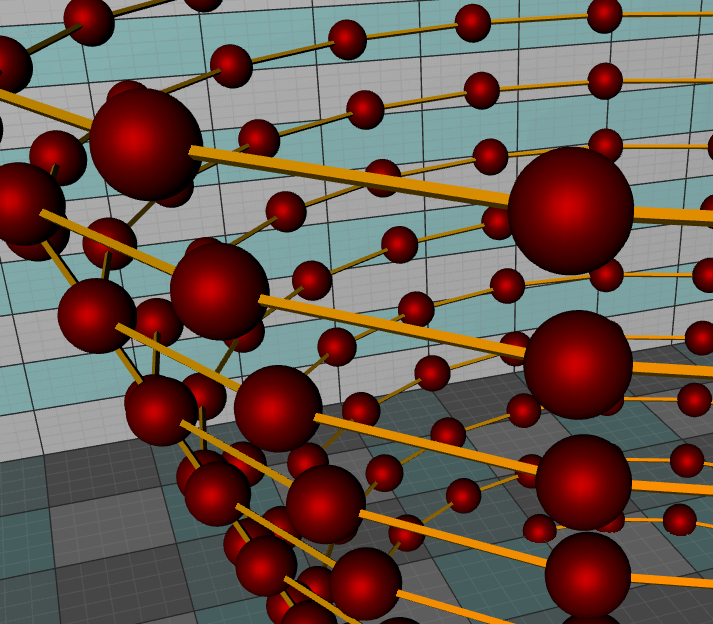
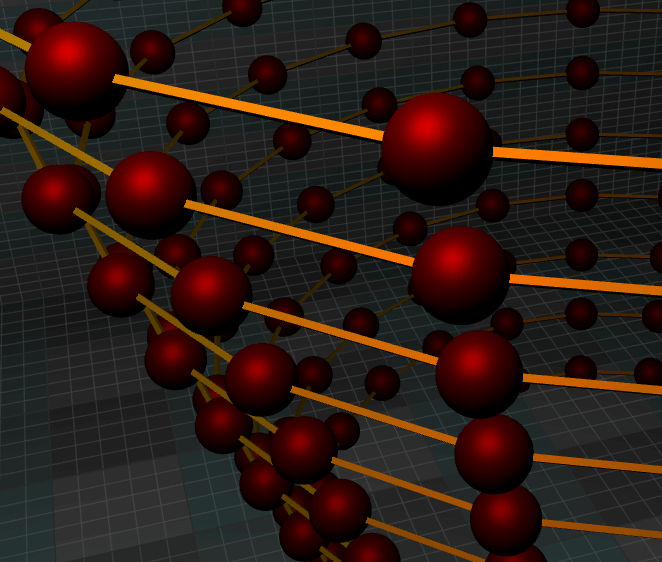
Light and surface interactions
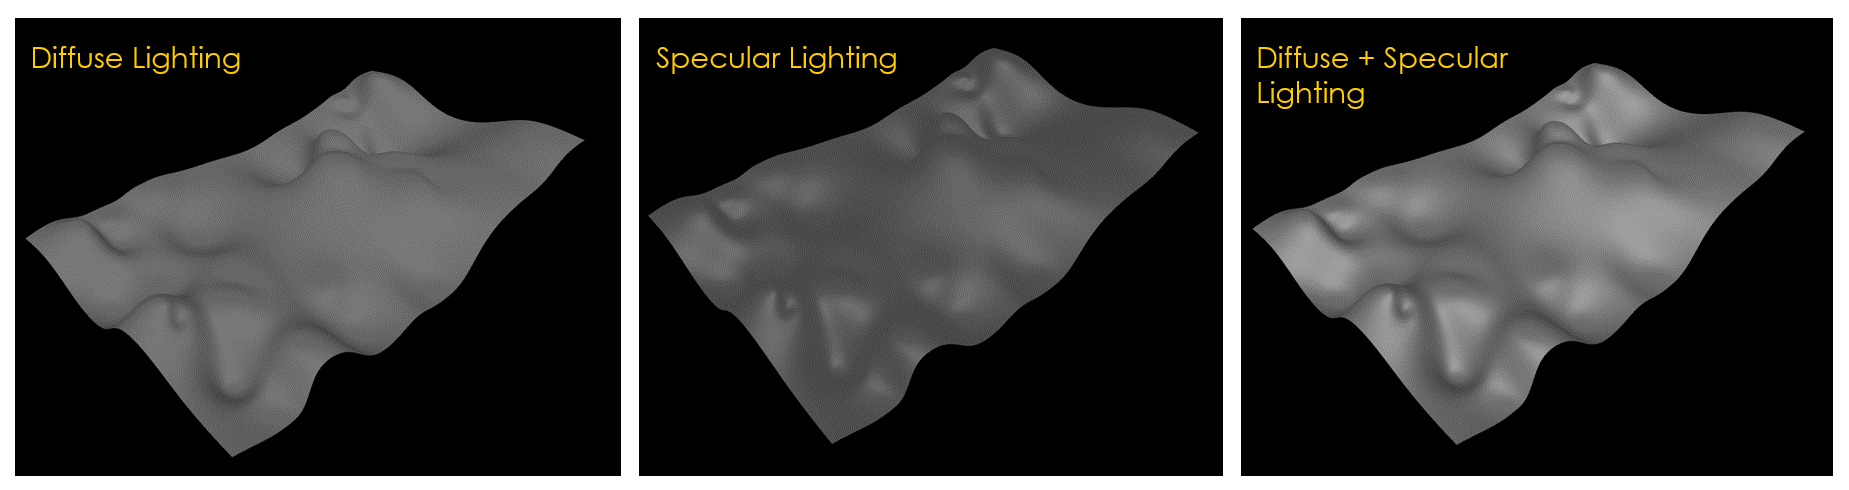
Computation on GPU
Conclusion
Smith Chart
Written by a human | Updated on April 11th, 2025Smith Chart The Smith Chart is named after its inventor Phillip Smith, who developed it at Bell Telephone's Radio Research Lab during the 1930s. It is believed that Mizuhashi Tosaku developed this tool independently...
React Bar Chart
Written by a human | Updated on April 11th, 2025React Bar ChartIf you have seen the previous articles, we have practiced with various JavaScript-based frameworks. We have implemented the Lightning Charts library and taken advantage of its great compatibility with each...
javascript candlestick chart
Written by a human | Updated on April 11th, 2025What is a JavaScript Candlestick Chart? A candlestick chart is a type of price chart used in technical analysis, which shows a security's high, low, open, and closing prices over a given time frame. It was...


If you have any questions, feel free to contact us!
©LightningChart Ltd 2026. All rights reserved.