


Lighting

Introduction
Light Sources
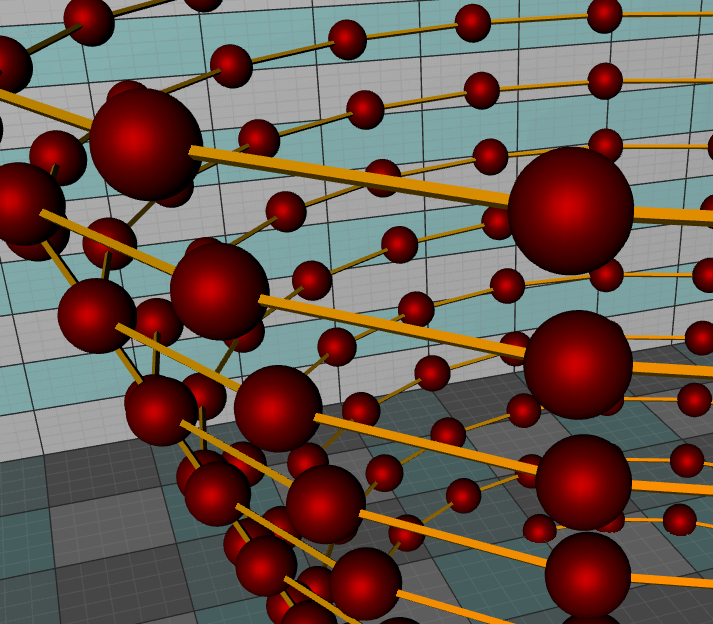
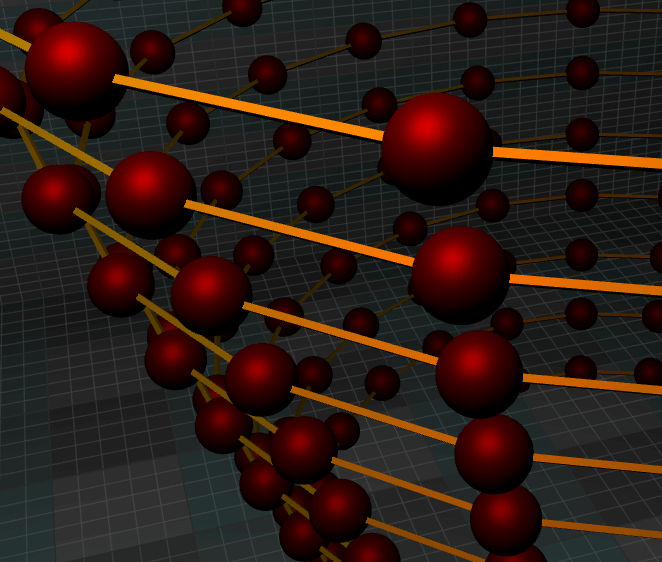
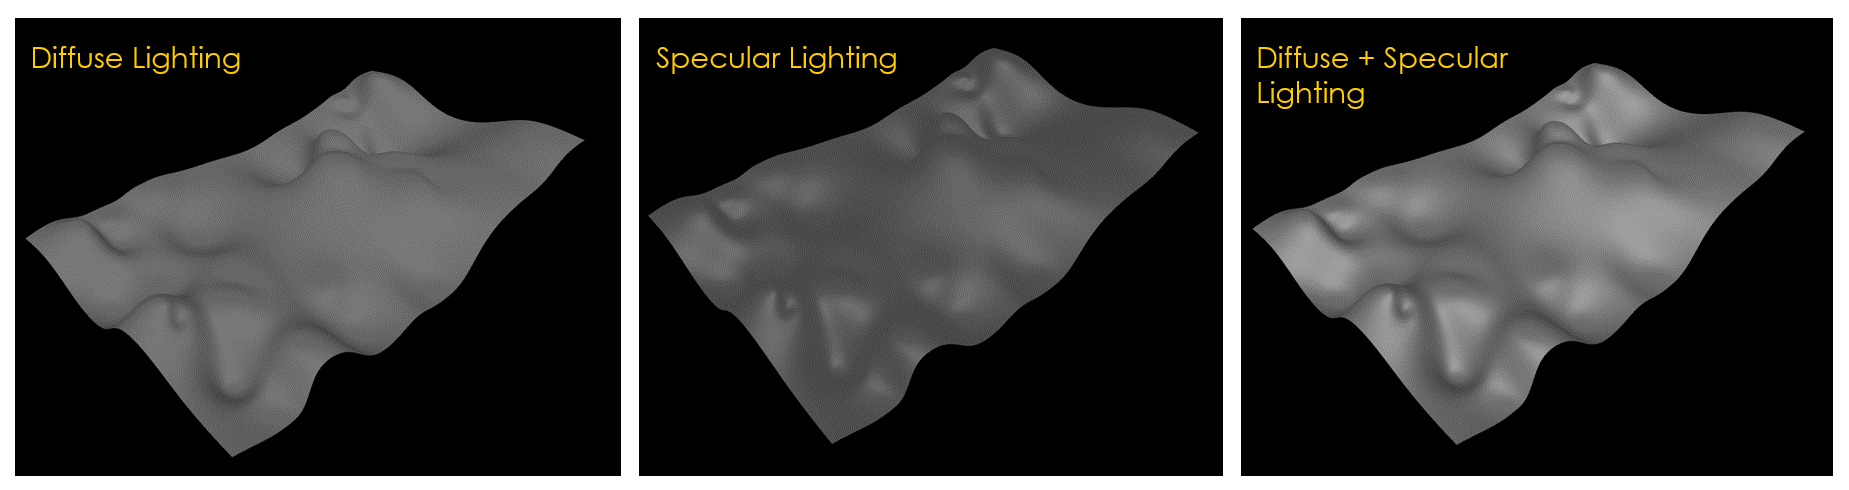
Light and surface interactions
Computation on GPU
Conclusion
WPF 2d Heatmap
Written by a human | Updated on April 14th, 2025Introduction to WPF 2D heatmapsHi again! As part of my article tutorials for WPF data visualization, we will create a 2D heatmap using LightningChart .NET interactive examples tool. As you know, a heatmap is a graphical...
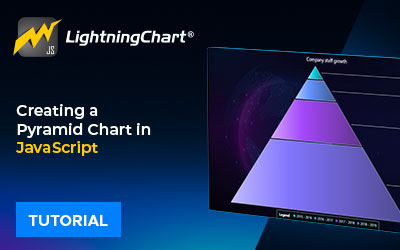
Creating a pyramid chart
Written by a human | Updated on April 14th, 2025Creating a pyramid chart in JSToday, we will be creating a Pyramid Chart using Lightning Chart JS and Node JS. A pyramid chart gets this name because the values are represented in semi-triangular sections until they form...
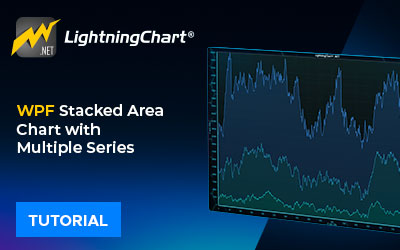
Area Chart
Written by a human | Updated on April 24th, 2025WPF Area ChartIn this article, we will make an Area Chart or Area graph using LightningChart .NET and interactive examples application. But… what is an Area Chart? An area chart is a combined line and bar chart. When we...


If you have any questions, feel free to contact us!
©LightningChart Ltd 2026. All rights reserved.