


Lighting

Introduction
Light Sources
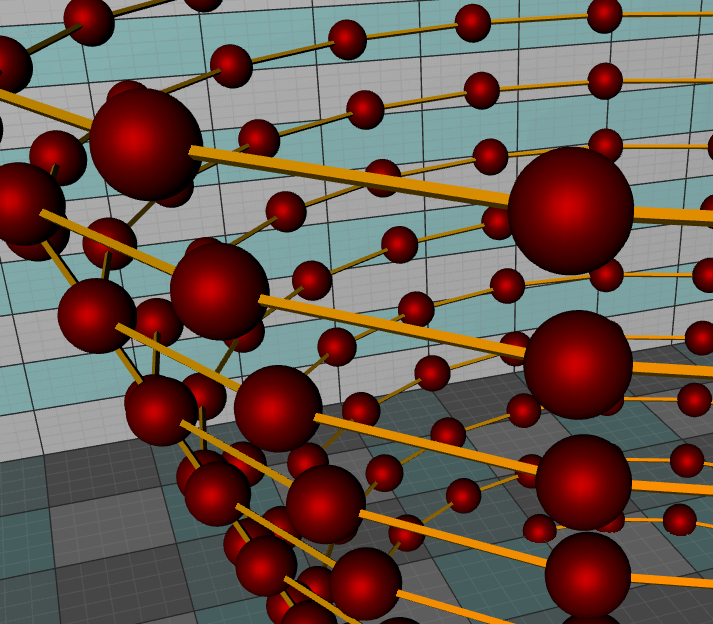
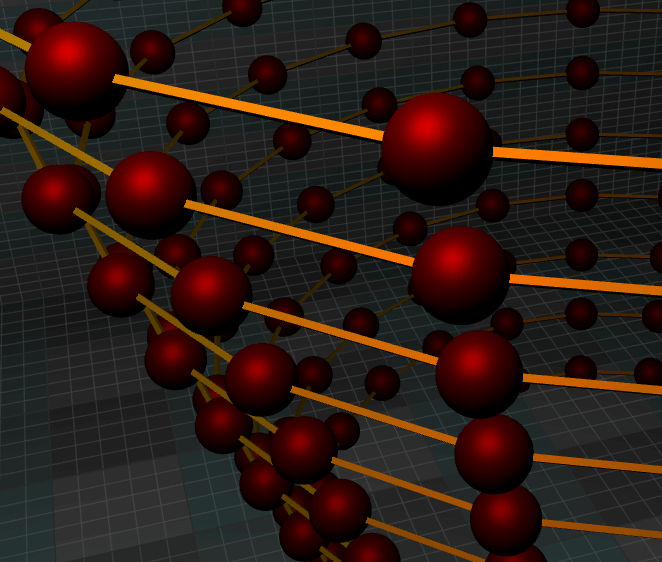
Light and surface interactions
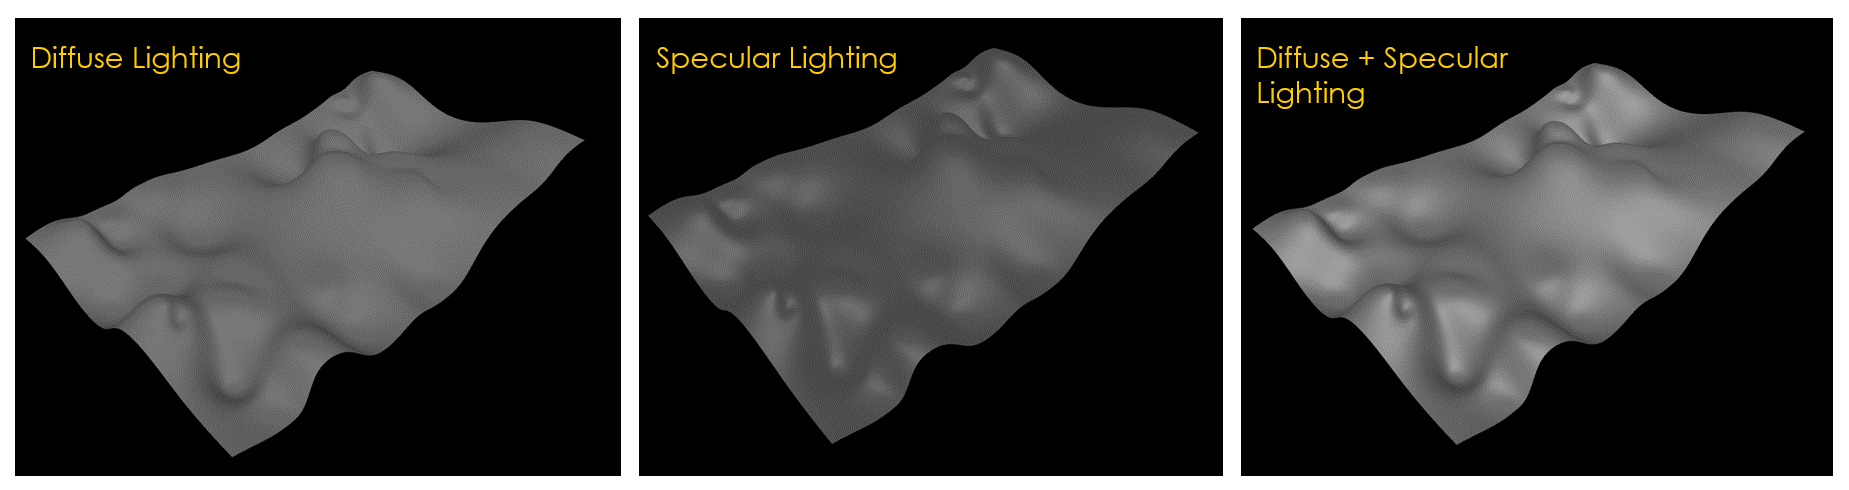
Computation on GPU
Conclusion
WPF 2D Maps
Written by a human | Updated on April 23rd, 2025Introduction to WPF 2D MapsIn this article, we’ll talk about WPF 2D maps in geospatial data visualization and the tools the LightningChart .NET library offers us to generate this type of chart. What does Geospatial mean?...

WPF 3D Maps
Written by a human | Updated on April 23rd, 2025WPF 3D MapsHello! In this article, we will focus on the theory behind WPF 3D maps. It will also serve as an introduction to creating this type of chart using the Lightning Chart .NET tools. If you have seen our previous...
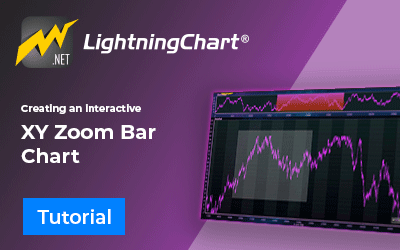
XY Zoom Bar Chart
XY Zoom Bar ChartToday we will continue working with XY charts, but now we will have two charts within the same project. A chart will traditionally display a signal while the other chart will serve as an analysis tool showing us the area of the signal we are studying....


If you have any questions, feel free to contact us!
©LightningChart Ltd 2026. All rights reserved.