


Lighting

Introduction
Light Sources
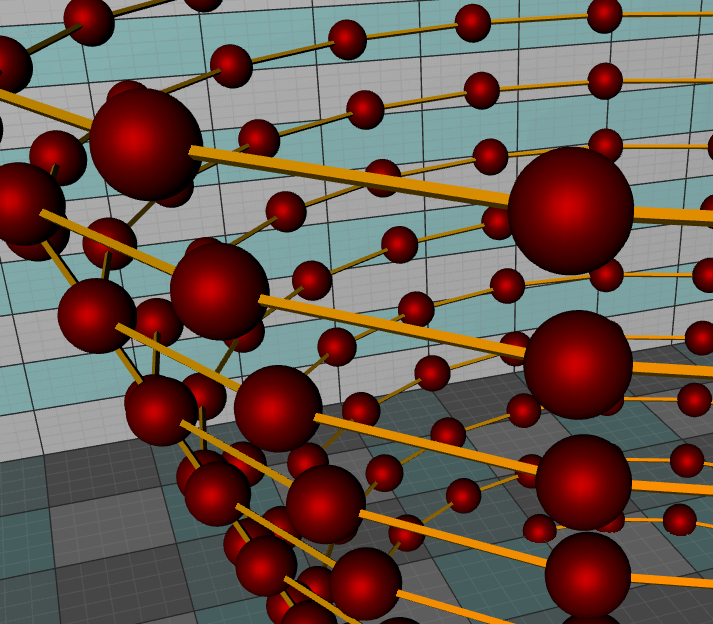
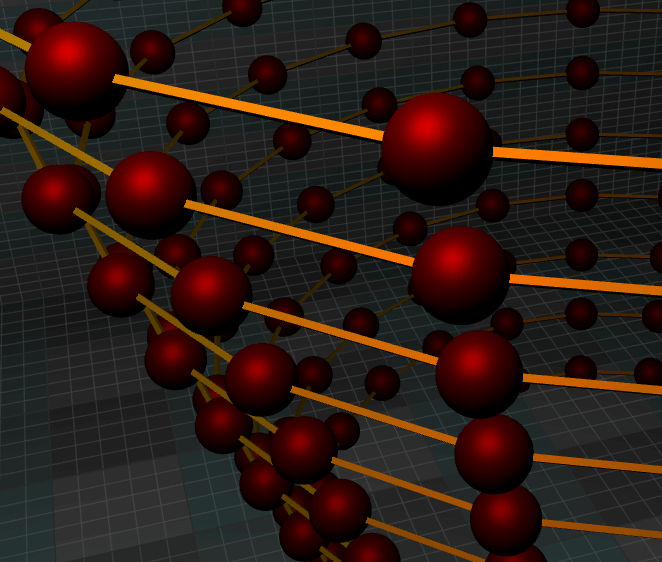
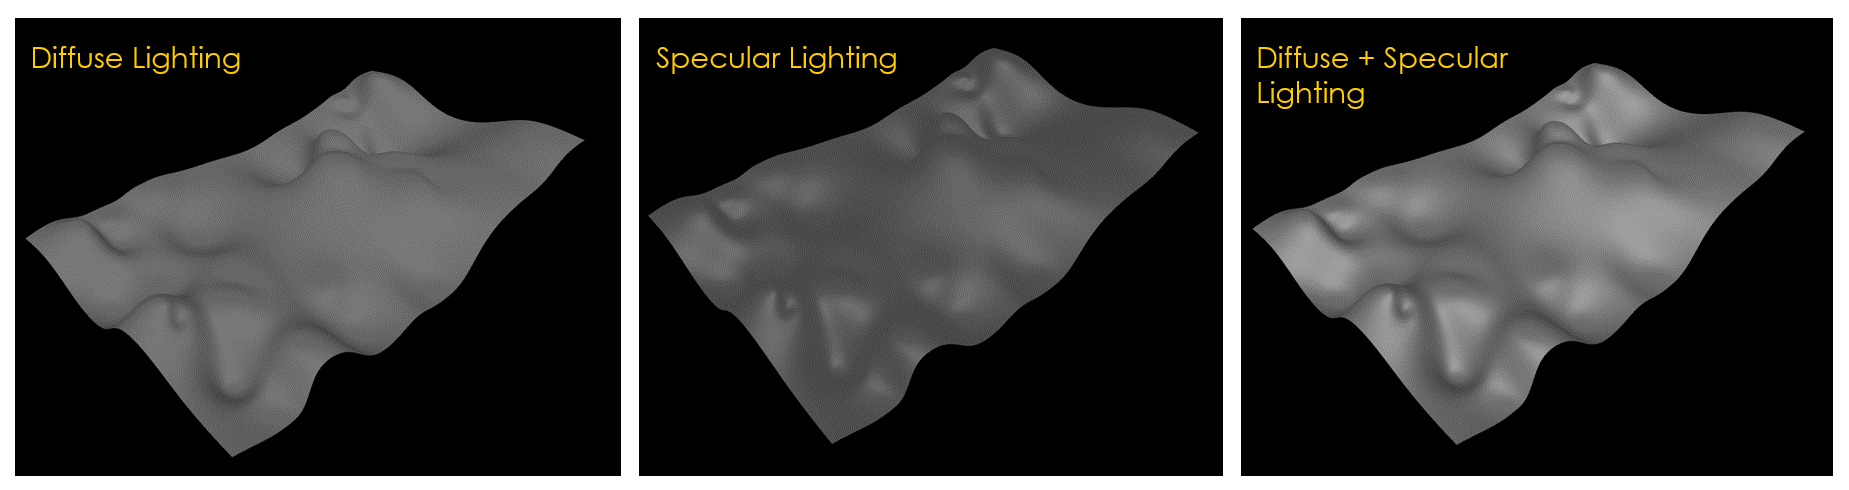
Light and surface interactions
Computation on GPU
Conclusion
Introduction to Area Graphs
Written by a human | Updated on April 23rd, 2025Introduction to Area GraphsArea graphs are a chart type for visualizing data which provides a clear and intuitive representation of data trends and patterns over time or across categories. By utilizing shaded areas, area...
SQL and LightningChart JS dashboard
Written by a human | Updated on April 23rd, 2025SQL Dashboard ApplicationHello! In today's article, we will see work on a small project using several development tools. We will create an SQL Dashboard with data generated in SQL Server and use Angular for web...
JavaScript 2D Bubble Chart
Written by a human | Updated on April 23rd, 2025JavaScript 2D Bubble ChartIn this article, we will create a JavaScript 2D bubble chart using Node JS and LightningChart JS. Remember that you can download the template and use it to experiment with it. When we are...


If you have any questions, feel free to contact us!
©LightningChart Ltd 2026. All rights reserved.