


Lighting

by Alexey Tukalo
Introduction
The combination of shades and lights is essential for the demonstration of a photorealistic 3D object on 2D screens. Shadows are nothing more than the absence of light, therefore discussion of light source sounds like a perfect start for our journey.
Light Sources
A scene usually contains several independent light sources. A pixel brightness is calculated for every light source separately and summed together to get an amount of light reflected towards a camera. There are five light sources types which we are going to discuss:
1. Ambient light fills the entire space uniformly. Surface position and direction don’t have any influence on the final result. There are no shadows if there is only ambient light on a scene, thereby everything looks flat. A small portion of this light type can be used as a fill light, to add some details to the surfaces in deep shadows.
2. Directional light is the simplest type of light which is able to produce shadows. It takes into account the only direction of the light source and location of exposed surface. It has no analogy in real life, but in many cases, it can be used for simulation of certain lighting effects. It is a right choice for simulation of a very powerful and remotely located light source.
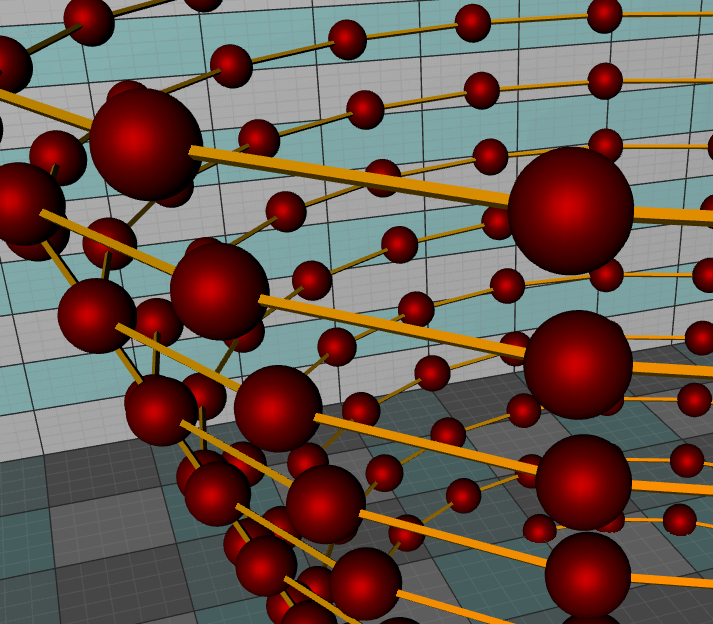
3. Point light is emitted in all directions from its centre. Brightness is defined by the relationship between the location of a surface and a light source. Sun is the closest real-life example of the point light.
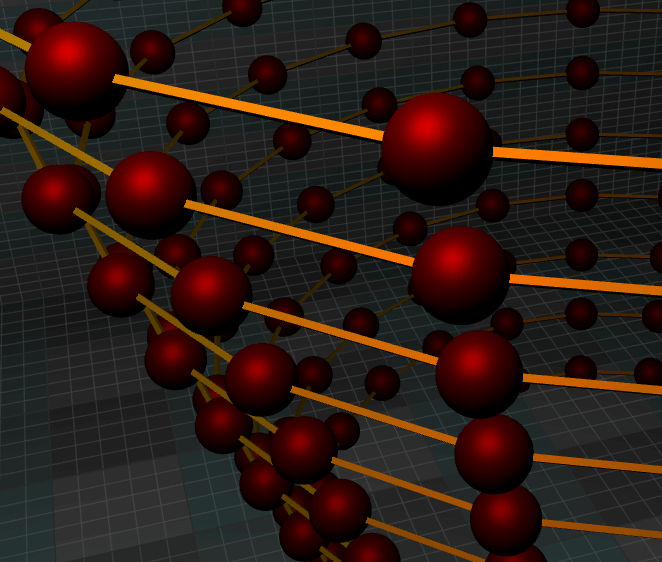
4. Spotlight is a limited version of the point light. It shines only at a certain angle. The lamp is a perfect real-life example of this light source type. It is most commonly used for the creation of photorealistic images.
5. Area light is an advanced version of the point light. In this case, light is emitted by arbitrary shape instead of a point. The neon light is a real-life example of the technology.
Light and surface interactions
Light sources have to interact with the object to produce the final image. There are several different ways how the interaction can happen.
Emission Lighting is the simplest type of lighting. It ignores all light sources and defines the lowest brightness of the object. To some extend it is similar to the Ambient light which is focused on a single object. An advanced rendering engine can treat the object with Emission Lighting as Area light sources.
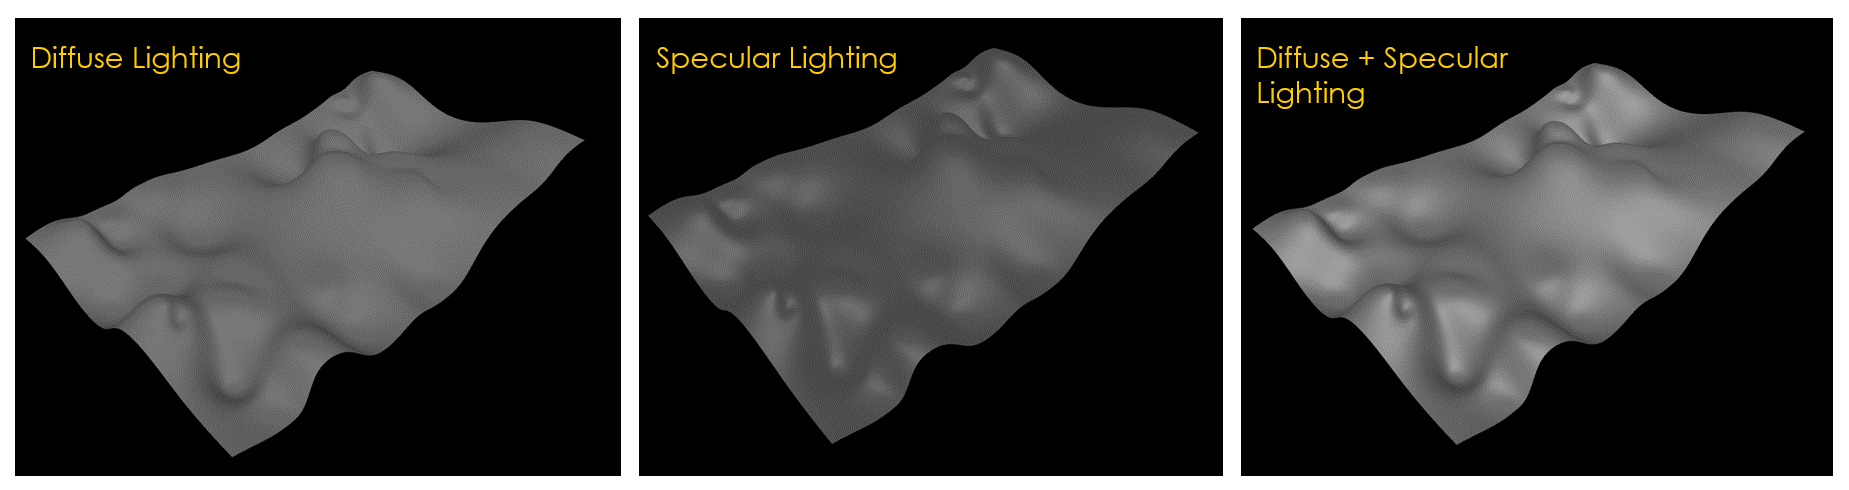
Diffuse Lighting is a part of light which would be reflected from ideal “matte” surfaces. It is the most important type of lighting for accurate shape perception. It is calculated as a dot product between vector normal and the vector of the light ray. Vector normal is a vector perpendicular to the surface at the certain point.
Specular Lighting represents a mirror-like reflection of light sources. It lets the viewer feel the smoothness of surfaces. Specular lighting tends to be essential for the rendering of glossy objects. In addition to the surface’s vector normal and vector of the light ray, calculation of specular lighting requires information about camera position. The specular highlight happens if the vector of a light ray at the hit point is directly reflected towards the camera.
The level of influence of the lighting type on the shading of particular objects is defined by coefficients. Together with the texture, they form a material which is used to describe the appearance and reflective characteristics of the surface.
Computation on GPU
Lighting calculation is a very expensive part of rendering, thereby it is important to understand how it can be done in an efficient way. It is also important to discuss aggressive approaches for an optimization of the process and trade-off related to them.
There are two main choices for GPU accelerated computation. It can be executed at fragment/pixel shader or at vertex shader. You can read more about shaders here.
Due to inaccuracy occurred at the rasterization stage, the brightness calculated at vertex shader can be inaccurate. It is especially bad for calculation of specular lighting because the approach is not able to perform a precise transition of the highlight’s shape. Moreover, small highlights located in a center of polygons are completely lost in case of per vertex lighting. That is why per fragment lighting is the most common solution for modern 3D engines. It provides more accurate and smooth results. Nevertheless, calculations located at fragment/pixel shader are executed much more frequently, which makes the approach relatively slow. Therefore, per vertex lighting is preferred for intensive engineering and scientific visualizations, because performance there is significantly more important than photorealism.
Conclusion
Lighting Calculation is a computationally intensive process which can be efficiently accelerated by parallel execution on GPU. More advanced techniques for acceleration of the process, especially in a case of scenes with a huge number of light sources, would be a further discussion in the next article.
Audio Signal Visualization of MP3 Data with LightninChart JS
Create an audio signal visualization featuring spectrum and waveform analyzers to visualize MP3 audio data using LightningChart JS.
Standard Deviation in Statistics for Financial Analysis
Standard deviation in statistics helps assess price movements, market trends, and portfolio risks in the financial world.

3 Point Moving Averages Explained: Guide with LightningChart JS Trader
Moving averages help traders spot trends and make better decisions. Explore the types and learn how to create them with LightningChart JS Trader


If you have any questions, feel free to contact us!
©LightningChart Ltd 2026. All rights reserved.