


JavaScriptCreating a JS scatter chart with LightningChart
TutorialLearn how to create an interactive XY chart with the lcjs library
Written by a human | Updated on April 9th, 2025
LightningChart JS
This is a quick technical look into some interesting features of LightningChart JS XY charts and how to create an embedded scatter chat and add custom interactions to it using LightningChart JS.
This chart will visualize a list of XY coordinates along with an extra custom property which is just a piece of text. These custom properties will be displayed with UI text elements that will interact with the user’s mouse movement.
What is a scatter chart?
A scatter chart or scatter diagram is a mathematical visualization whose purpose is to visually represent the correlation between two numeric variables. Where the correlation is that comparison represented in the scatter plot to demonstrate any possible relation between those two variables.
As the diagram uses cartesian coordinates for a visual representation of two variables, one on each axis (X, Y) the dots will form a line if the variables are correlated. So, when to use a scatter chart? Usually, this type of chart is used whenever there are two quantitative variables and the dependent variable has several values for every single value of its independent variable.
How to create a scatter chart?
The chart will be created using LightningChart for JavaScript, you can learn more about it by visiting the LightningChart JS website.
Creating a scatter chart is a breeze with LightningChart JS, below is a simple code snippet that will:
- Create an XY chart.
- Create a Point Series.
- Populate the series with a randomly generated data set with 100 items.
For the not-programmer people reading, try and read through it without paying too much mind to detail and I think the point will come across.
const chart = lightningChart().ChartXY()
const pointSeries = chart.addPointSeries()
pointSeries.add(new Array(100).fill(0).map(() => ({
x: Math.random(),
y: Math.random()
})))
If you are unfamiliar with LightningChart, you might wonder what makes this chart special. Performance. At LightningChart we make everything as fast as possible – the Point Series component we used just now can prepare an interactive scatter chart with more than 10 million data points in a matter of seconds!
What’s our secret? Hardware-accelerated graphics and long dedication to enabling demanding data visualization applications.
Attach custom properties to data points
When supplying Lightning Chart JS with data, we embrace the format of JavaScript objects, which allow any amount of key: value combinations. In the previous code snippet we saw the creation of JavaScript objects with X and Y properties:
const point = { x: 0, y: 0 }Adding custom data point properties is as simple as one might guess: add them after x and y:
const point = { x: 0, y: 0, custom: 'abcdefg' } These custom properties can then be used with data cursors, solving data points from mouse location, etc. In this example, we’ll use them with UI text elements.
How to add interactive UI text elements?
Next, we’ll add labels next to every scatter coordinate. These will display the custom data point property and activate when the user moves their mouse close to them.
This code adds a single label, positions it next to the data point, and sets it to display the text from the data “custom” property.
const label = chart.addUIElement(
   UIElementBuilders.TextBox,
   { x: xAxis, y: yAxis }
)
label
   .setPosition(point)
   .setMargin({ bottom: 10 })
   .setText(point.custom)
We can also do a little trick here, which will significantly help us later on. Let’s add another custom property to the data point – the UI text element.
point.label = labelThe last step is to follow the user’s mouse movement and activate the closest data point by coloring it solid white. This code monstrosity looks menacing, but at least the idea is simple:
when the user moves the mouse to a data point, the color label will change to white
chart.onSeriesBackgroundMouseMove((_, event) => {
const nearestDataPoint = pointSeries.solveNearestFromScreen(chart.engine.clientLocation2Engine(event.clientX, event.clientY))
if (nearestDataPoint) {
label.setFillStyle(new SolidFill({ color: ColorRGBA(255, 255, 255) }))
}
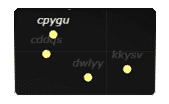
})Final result
Here is the final result as an embedded chart. The full source code can be found in GitHub by clicking on the icon in the top-right corner of the embedded chart.
If you want to learn more about LightningChart JS charts, you can browse the library and get familiar with all the interactive examples.

Niilo Keinänen
CTO, LightningChart JS
Continue learning with LightningChart

Temperature Monitoring Application
Written by human on February 19th, 2024Temperature sensor applicationsReal-time temperature monitoring applications are an essential tool for engineers and developers in industrial sectors. Temperature monitoring applications use temperature sensors, thermal sensors,...
WPF 3D Sphere
Written by a human | Updated on April 23rd, 2025WPF 3D SphereIn this article, we will create a WPF 3D sphere globe chart using the Lightning Chart .NET library. As we know, a WPF 3D globe chart is a 3D sphere representing the Earth that shows the Earth's surface and...
WPF 2D Maps
Written by a human | Updated on April 23rd, 2025Introduction to WPF 2D MapsIn this article, we’ll talk about WPF 2D maps in geospatial data visualization and the tools the LightningChart .NET library offers us to generate this type of chart. What does Geospatial mean?...


If you have any questions, feel free to contact us!
©LightningChart Ltd 2026. All rights reserved.