


How to EmbedInteractive Charts in PowerPoint Easily
TutorialExtremely easy-to-follow tutorial how to embed interactive charts into your PowerPoint presentations.
Written by a human | Updated on April 9th, 2025
Embed interactive charts in PowerPoint presentations
Embedding charts within PowerPoint presentations has always been possible but perhaps one of the most ignored possibilities is actually embedding web applications directly in the presentation sheets.
Did you know this was possible to add this charts in PowerPoint?
As said, this is a rarely known feature, to say the least. We at LightningChart just found this out and immediately tested it with our powerful real-time charts. Ever wanted to display a patient’s heartbeat in real-time while presenting? Hehe, probably not?, but now it is possible:
Here’s another example of what a real-time map dashboard looks like within a PowerPoint presentation.
The coolest part here is that these charts are fully interactive even during presentations, and they perform with the full LightningChart performance. Okay, enough with the silly demonstrations, show us how it’s done!
How to embed charts in PowerPoint?
Embedding charts and any other web application is possible thanks to a PowerPoint Add-in called Web Viewer. That’s right, embedding websites are not supported out of the box, but this can be fixed by downloading an extension to the default features, which are known as Add-ins.
And don’t worry! This is an official add-in published by Microsoft that you can either directly download the Web Viewer add-in from the Microsoft store or install right from your PowerPoint.
Opening right from the Microsoft Store
You can visit and download the Web Viewer add-in from the Microsoft Store and:
1. Click on “Open in PowerPoint“.

2. Accept the pop-up window asking for permission to open PowerPoint.
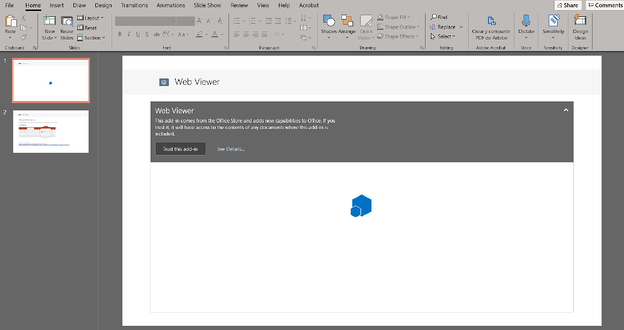
3. Once in PowerPoint, you’d have to click on “Trust this add-in”.
Opening right from PowerPoint
Here’s how it works, you add a Web Viewer to your sheet:
1. Click on the Insert tab then My Add-ins
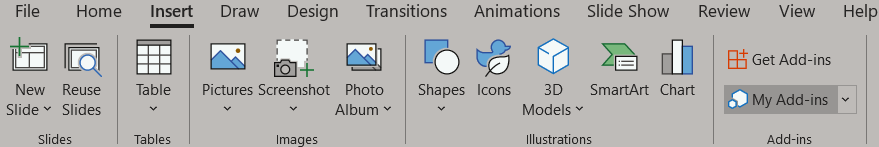
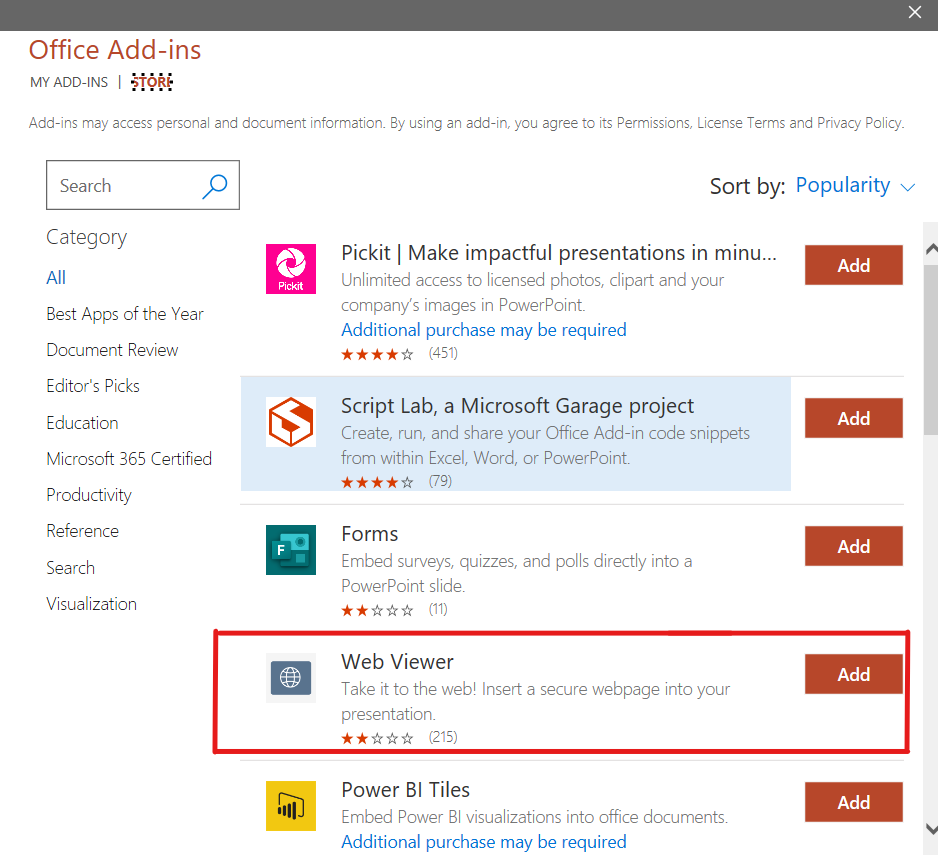
2. Click on the Office Store button (or tab) and almost immediately, you’ll see the Web Viewer add-in. Click on add, agree to the terms and conditions, and accept. Good to go!
Selecting the charts to embed in the PowerPoint presentation
Now all you have to do is to input the URL to the website that you want to show. This must be a secure site, meaning that the URL has to start with “https”.
Select your chart from the gallery & embed it.
To select a chart, go to LightningChart JS interactive examples and copy the URL of any chart you want. In this case, I’m selecting the JavaScript 3D Surface Grid Chart that has the following URL:
“https://lightningchart.com/js-charts/interactive-examples/examples/lcjs-example-0912-surfaceGrid.html”
- This URL needs to be changed to the following format: https://Lightning-Chart.github.io/lcjs-example-0912-surfaceGrid/
- So you’ll have to use the form https://Lightning-Chart.github.io/ + the visualization name starting with “lcjs-example…”
- Don’t include the “.html” ending!
Once in PowerPoint, navigate to Insert > My Add-ins > Web Viewer, and replace the URL with the one from your chart and remove the “https://” part (as is already written there). Click on “Preview” and you’ll see your chart ?
Finally for developers here’s a special treat that guides you on how to transform your development applications to securely hosted web applications, allowing you to place them in your or your colleagues’ presentations.
Web.dev guide to using HTTPS in locally running applications. Now go and make your next presentation the flashiest one around – creative madness!
About LightningChart Data Visualization Library for Desktop, Web & Mobile Application Development
LightningChart Data Visualization Solutions are advanced data visualization libraries for .NET and JavaScript featuring 200+ charts that can be easily integrated into cross-platform applications that demand high-performance charts with fast rendering and large dataset processing of several billions of data points.

Niilo Keinänen
LightningChart JS CTO
Continue learning with LightningChart
Stock Price Prediction in Python
Written by a human | Updated on April 23rd, 2025Stock price prediction in PythonWhat is the stock market and how does it operate? The stock market, a complex network of buyers and sellers trading shares, operates as one of the most pivotal components of a free-market...

ECG Signal Processing in Python
Written by a human | Updated on April 23rd, 2025Visualizing ECG Signal Processing in PythonElectrocardiogram analysis (ECG analysis) is a process of recording, processing, and analyzing a patient’s heart’s electrical activity. This activity is recorded from a patient...

Real-time Seismic Activity Monitoring Application
Written by a human | Updated on April 23rd, 2025Python Seismic Data Processing ApplicationWhat is seismic data processing? Seismic data processing interprets data collected from Earth’s subsurface features. This data can be crucial for applications such as oil and gas...


If you have any questions, feel free to contact us!
©LightningChart Ltd 2026. All rights reserved.