Data VisualizationMotorsports analytics for accelerating performance on car racing competitions.
ArticleLearn how motorsports analytics is used in motorsports for real-time strategical decision-making.
Updated on October 12th, 2023 | Written by human
Motorsports Analytics
Large companies in the motorsports industry are collecting huge volumes of real-time data coming from different sources on and off the pitch during racing competitions.
These data are both collected from the car and the car engine itself and are meant to help drivers and engineers to understand the behavior of the machine in a dynamic environment.
Understanding the behavior of the vehicle during a race is key to making improvements in the performance of the entire racing team (such as Formula 1 teams!). High-performance data visualization in motorsports can lead a team to an improvement in performance during a race.
The way engineers collect the data is through several different processes, for example, data can be collected from vibration monitoring and other motorsports analytics multichannel engine measurements joined to different sensors transmitting the live data to a data logger application.
Decisions in motorsports need to happen in real time!
Key Takeaways
- Motorsports analytics is key to monitoring, analyzing, and improving cars’ performance.
- From drivers and engineers to sports specialists and fans, all use data visualization to understand races and performance.
- Data logger applications collect racing data through multiple sensors integrated within the racing vehicles.
- The fastest and highest-performance charting controls are necessary to visualize and render data from data logger systems.
- Data visualization in motorsports needs to be as fast as racing cars.
Motorsports Analytics Applications
From the driver himself, passing to the engineers, and to the fans themselves, in motorsports, everyone is using high-performance data visualization that processes real-time vehicle data.
New Talent Acquisition and Monitoring
Within the most prestigious racing competitions such as Formula 1, data is also used to identify the most promising and talented drivers. Often, Formula 2 and Formula 3 drivers are promoted in their careers and move to higher competition levels.
Despite the competition category, their vehicles are always connected to data loggers that help analyze their performance which makes it easier for bigger teams to spot and select players with the best stats!
Driver Performance Improvement
Every second and every lap counts in motorsports. Every decision made by engineers to their drivers is based on millions of data points sent from the car to the transmitter, and from the transmitters to the racing engineers’ dashboards that’ll ultimately run instant decision-making that’ll later be communicated to drivers.
Rivals Analysis
During a live race, engineers can keep track of their competitors and how they are performing compared to their own drivers. Based on a real-time analysis engineers can adjust or formulate racing strategies:
What’s the current status of the tires compared to the next “Px” tires? Is it wise to have a pit stop now or later? What are the distances between vehicles and when is an overtake available?
Journalists, Analysts, and Fans
In every sport, there are commentators, journalists, and specialists who talk about their expectations before and after a competition. In motorsports, analysts are in charge of communicating, let’s say, in an easy way the most important information coming from the pitch.
The majority of the spectators might not be necessarily data experts though for sure enjoy a race with key details about the car’s performance, the time intervals, lap stats, and more.
The same is also true for specialists and journalists who also write reviews or give their professional opinions on the competitions. While some of them might not have full access to the Scuderias’ and teams’ data sources, they still analyze public domain data that help non-specialists to understand and spot trends in a team’s good or bad performance.
Data Logger Applications
We’ve seen now why data visualization has become more important in motorsports as it improves the monitoring and decision-making of on and off-track performance of racing vehicles.
This is something that wouldn’t be achieved without the help of high-performance charting toolkits that make the visualization and data acquisition processes more efficient. A process that is rather simpler than performing a more conventional statistical analysis.
As stated by the former Chairman of the Barcelona F1 Grand Prix, Vincenç Aguilera:
“Live data flow is key as it can help to correct problems during a race”.
How is racing data collected in motorsports?
The short answer is data loggers. A data logger is an interactive and real-time system that provides visualizations of different information on racing vehicles (telemetry analytics).
Do drivers use data loggers? Drivers don’t necessarily need as many information channels as engineers but they do certainly use processed data from data loggers to monitor what happens in their vehicles.
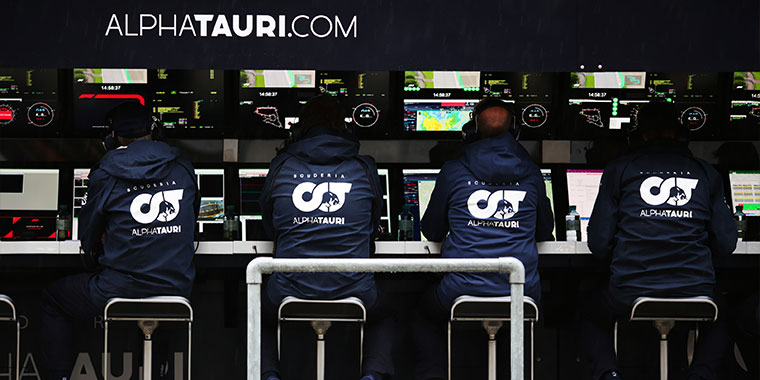
That said, engineers do make full use of a data logger system (see Alpha Tauri engineers) to understand, for instance, the information coming from advanced monitoring units within the racing cars. As mentioned earlier, the goal is to improve performance during races as quickly and accurately as possible.

When talking about improving the real-time performance of the vehicles, it is a must to also rely on real-time and high-performance data visualization charting controls that are as fast as a Formula 1 car.
High-Performance Charting Controls for Motorsports
In motorsports, one second can give or take away a podium. There are several factors that can affect the performance of a driver. The driver himself is one but there are also data miscommunications that have happened during the entire life of motorsports competitions between the team and the driver.
There is the importance of relying on fast and high-performance charting controls that once integrated into data logger systems, can provide live information and handle millions and even billions of data points in real-time that assist racing teams to manage performance during a race.
The data visualization performance of the application and all its components will determine how smoothly the chart renders the live data. Something that is key for engineers and drivers to make strategic decisions on and off the pitch.
Here’s what the LightningChart world’s fastest charting controls for motorsports look like within a data logger system while processing live data sources.
TestLogger Racing Analytics
TestLogger is a data management and analytics system for radio-controlled racing vehicles such as F1, Nascar, and the World Rally Championship.
As seen, teams in motorsports are using radio-controlled solutions to collect and visualize different data from the car engine and car racing history to improve the vehicle’s performance and the engine’s development race after race.
The secret behind an accurate and reliable data logger application in racing is the integration of high-performing charting controls. For instance, TestLogger has integrated the LightningChart charting tools that are designed to render more than 16 billion data points in real-time at the highest FPS rate.
That is how such companies as Honda Racing, F1 Alpha Tauri Team, Nascar, and VRC Rally teams can only rely on and integrate high-performance charting components to their applications in order to meet the highly demanding data requirements of their operations.
In essence, the TestLogger Analyzer is a data analytics tool designed for rendering full-scale motorsports analytics where different types of charts, calculations, and relations between data sources are employed to analyze both the driver’s and car’s behavior.
The Present & Future for Data Visualization Motorsports
Data have been analyzed since the beginning of racing competitions and thanks to technological development more data sources are being integrated into systems that help experts to interpret results.
It is true that today there are hundreds of data visualization solutions that fulfill different purposes. So, how do big companies (teams) in motorsports determine which data visualization solution is best for them?
P E R F O R M A N C E
As performance is everything in the motorsports field, it is also a key decision point when choosing the right data visualization motorsports tools for data-intensive applications.
LightningChart Advanced Data Visualization Controls for Desktop, Web, and Mobile Application Development

LightningChart is the highest-performing and fastest data visualization library for desktop, web, and mobile application development designed to render billions of data points at a record-breaking level on the market.
Companies such as Honda Racing Corporation, F1 Alpha Tauri Team, and Nascar teams such as Penske Nascar and Richard Childress Racing are using LighntningChart technology to build their motorsports analytics applications.
Learn more about LightningChart Advanced Data Visualization Tools and discover 100+ chart types for motorsports analyticsand the world’s most demanding industries.


